
According to the National Association of Realtors, September national home sales fell to the lowest level since 2010. You can see in the chart below of Twin Cities closed sales since 2004 how they have been falling the last 3 years. Nationally, September closed sales were 3.5% below last year… but locally, sales were down 11% compared to last year!
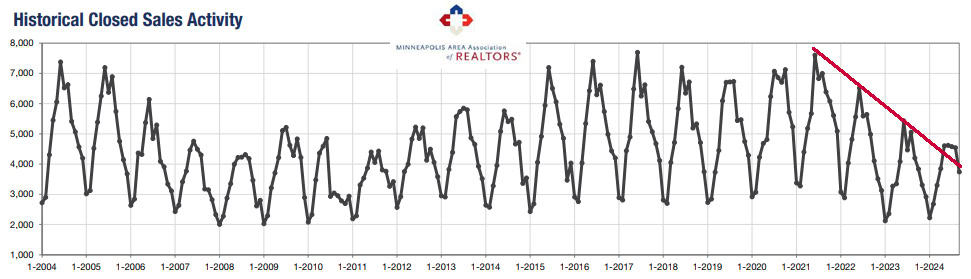
I heard at a recent seminar that there typically is a seasonal drop of 9.8% at this time of year and a 15% drop before a Presidential election, but NAR has stated presidential elections have little impact on the real estate market. Sales are on a downward trend typical at this time of year.

Both new listings and pending sales were up, but the drop in closed sales means inventory is continuing to grow as it has been all year.

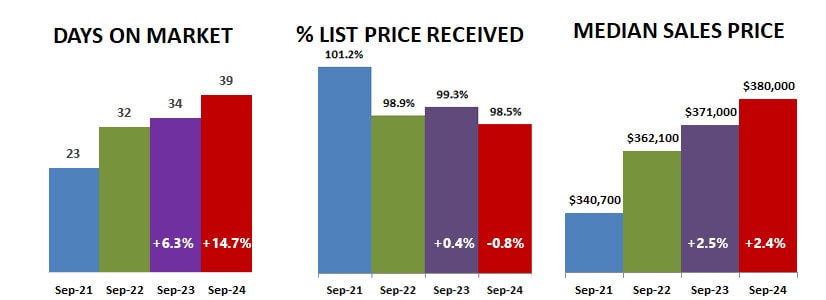
Days on market before pending is growing, but it is still lower than it was before the pandemic. Conversely, the percent of list price received is dropping but still fairly high at 98.5%… and median sales price continues to rise, as a result of continued competition due to low inventory.
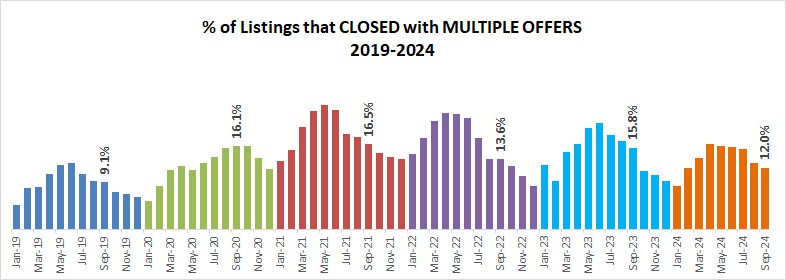
Multiple offers are not as strong as they were the last three years, but they are still ahead of what they were before the pandemic.
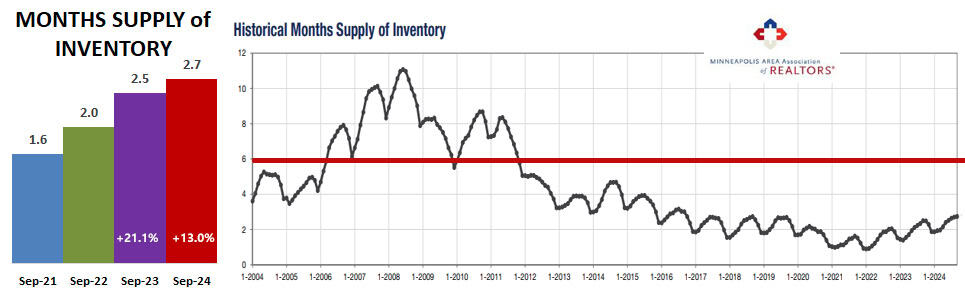
I have long felt that the best indicator of the health of the market is the months supply of inventory, considered balanced at 5-7 months. Nationally, September ended with a 4 month supply, which is still a seller’s market. But locally, we have only a 2.7 month supply… we still have a long way to go to get to a balanced market.
When breaking it out by price range, it is still a seller’s market in all price ranges under $1M, and homes $1M+ are just barely touching a buyer’s market. House price $150k-$250k have the lowest supply. Condos continue to have the biggest supply.

The supply of previously owned properties for sale increase 27.8% over last July, while new construction dropped 11.5%. Nationally, new construction makes up about 30% of all listings. In the Twin Cities, 25% of all listings are new construction.

The figures above are based on statistics for the combined 13-county Twin Cities metropolitan area released by the Minneapolis Area Association of Realtors.
Never forget that all real estate is local and what is happening in your neighborhood may be very different from the overall metro area.
Click here for local reports on 350+ area communities
Sharlene Hensrud, RE/MAX Results – shensrud@homesmsp.com
RELATED POSTS


