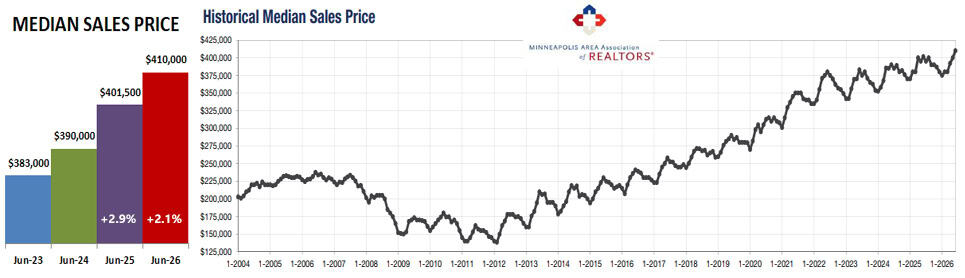
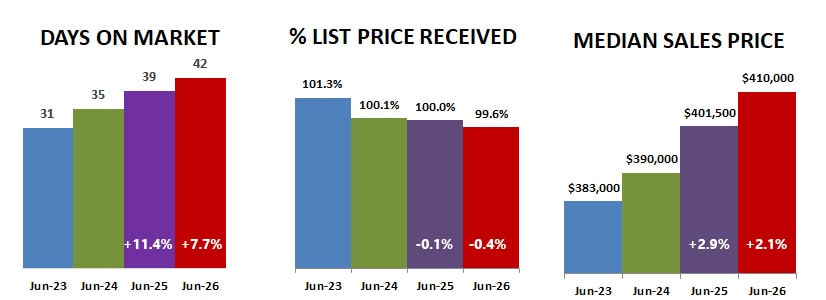
Year-over-year increase in median sales price in June 2026 was the highest so far this year, at an increase of 2.1% to $410,000. You can see in the chart below it is the highest it has been, going back to 2004.
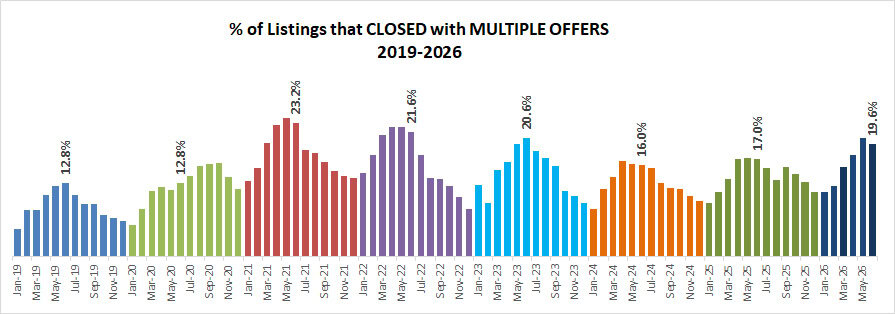
Multiple offers continued to be strong, with at least 19.6% of closed sales having multiple offers.
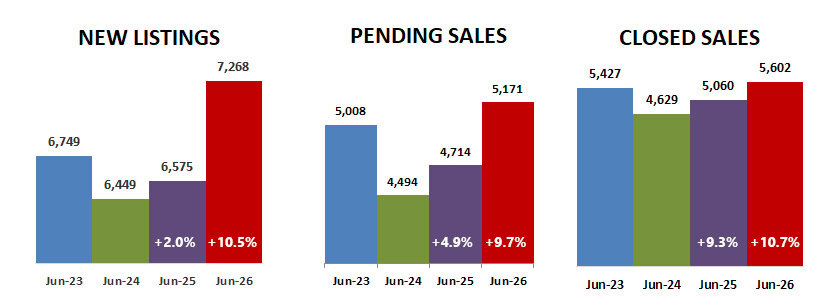
New listings, pending and closed sales all increased in June.
Days on market before pending and median sales price increased, even though average % of list price received decreased to 99.6%.
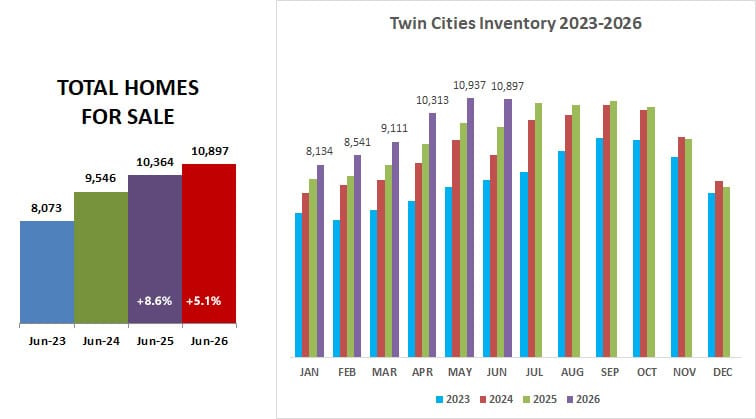
Total inventory continues to slowly increase, making things easier for buyers.
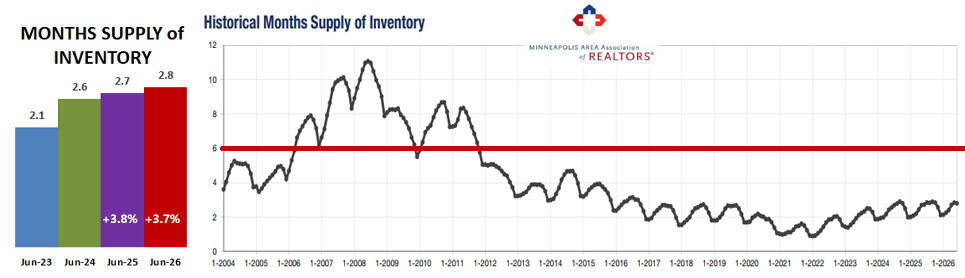
Months supply of inventory, which measures not just the number of homes for sale but also the rate at which they are selling increased again over last year in June 2026… up 3.7% year-over-year to a 2.8 month supply, but still way below a balanced market of 5-6 months indicated by the red line on the chart below.
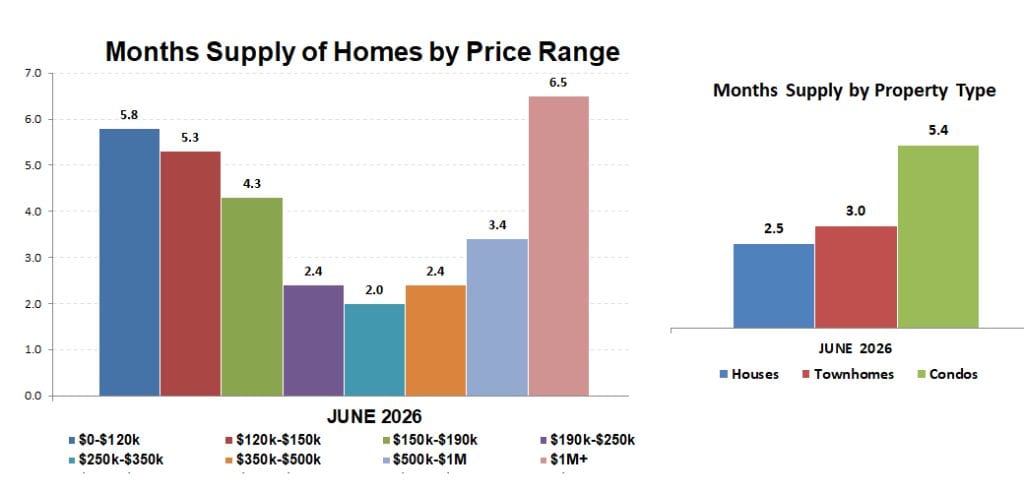
When months supply is broken down by price range, the $250k-$350k range still has the lowest supply at 2.0 months, with the $350k-$500k range not far behind at 2.4 months. Condos still have about twice the months supply as houses.
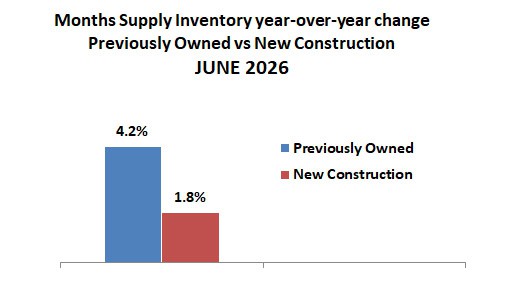
The supply of previously owned and new construction properties both increased over last June, with previously owned homes increase 4.2% to a 2.5 month supply. New construction supply increase 1.8%, to a 5.8 month supply.
The figures above are based on statistics for the combined 13-county Twin Cities metropolitan area released by the Minneapolis Area Association of Realtors.
Never forget that all real estate is local and what is happening in your neighborhood may be very different from the overall metro area.
Check with your Realtor for information on what is happening in your neighborhood.
Sharlene Hensrud, RE/MAX Results – shensrud@homesmsp.com
RELATED POSTS