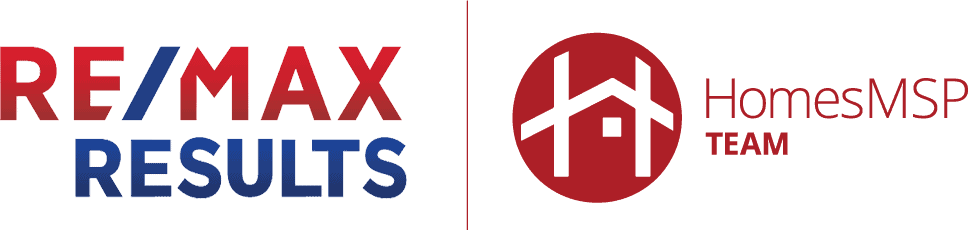
Inventory has been a problem for many years, but it has been inching up the last 3 years… August 2026 inventory is 7.9% higher than August 2025 inventory.
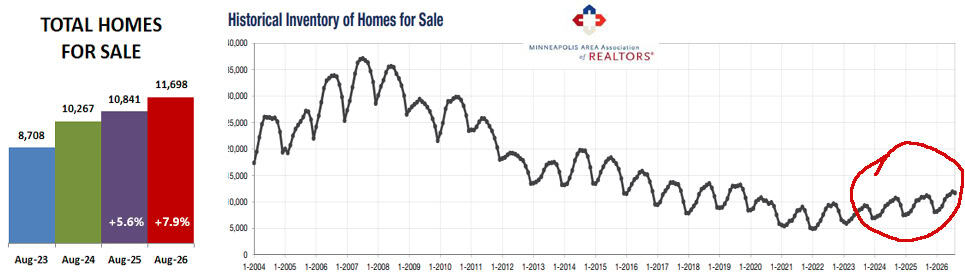
New August listings increased 8.2% over last year while pending sales lagged behind at 1.1% over last year and closed sales were 1.4% below last year.
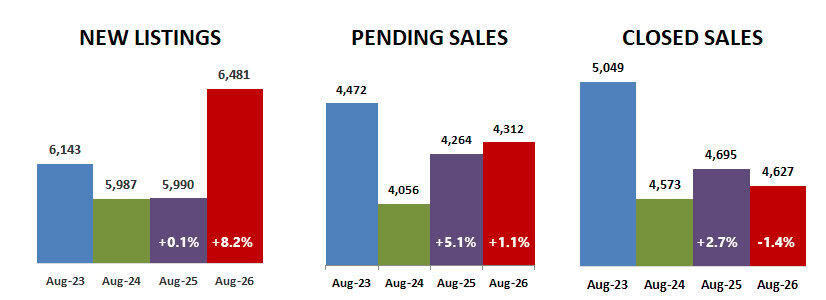
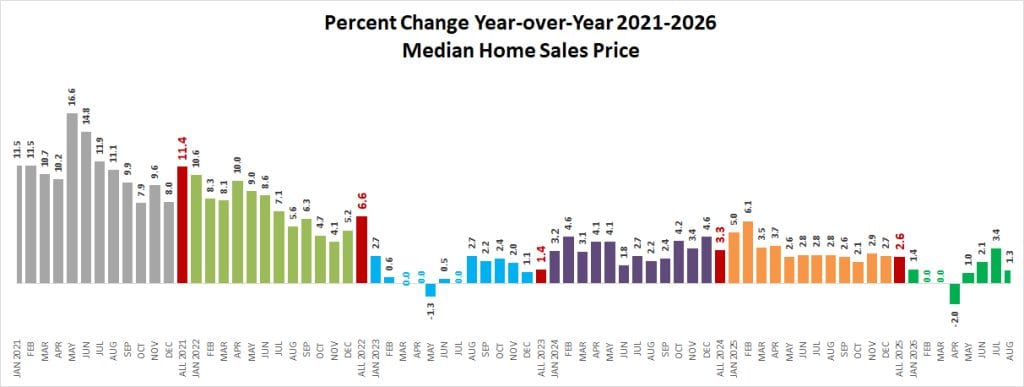
Days on market increased, indicating that while buyers are shopping they are becoming more picky in what they buy. Median sale price increased 1.3% to $405,000 compared to last August in spite of the % of list price received dropping by 0.6% to 98.2% of list price.
The 1.3% change in median home sale price is down from 3.4% last month and the lowest August change in the last 5 years. Another indicator of a slowdown, which could be a good sign for buyers.
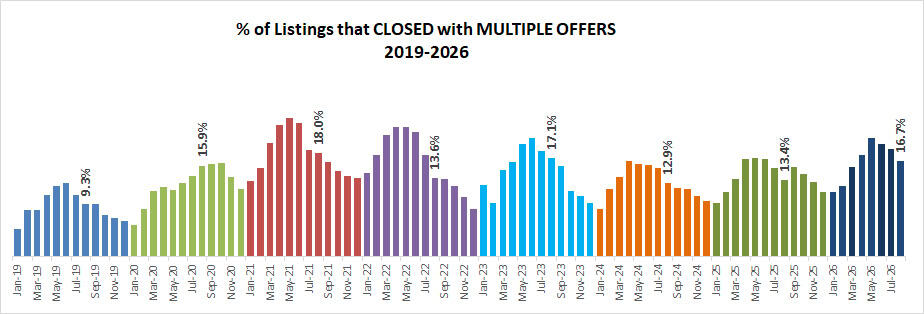
Multiple offers were still ahead of the last two Augusts, but typically not as many offers on a property as in 2021 – 2023… and also usually not as high above list price as in those years. Instead of average list price received being 100% or higher, it was 98.2% this August. However, there are always exceptions… buyers are more picky and willing to pay much more for properties in excellent condition and in an exceptional location.
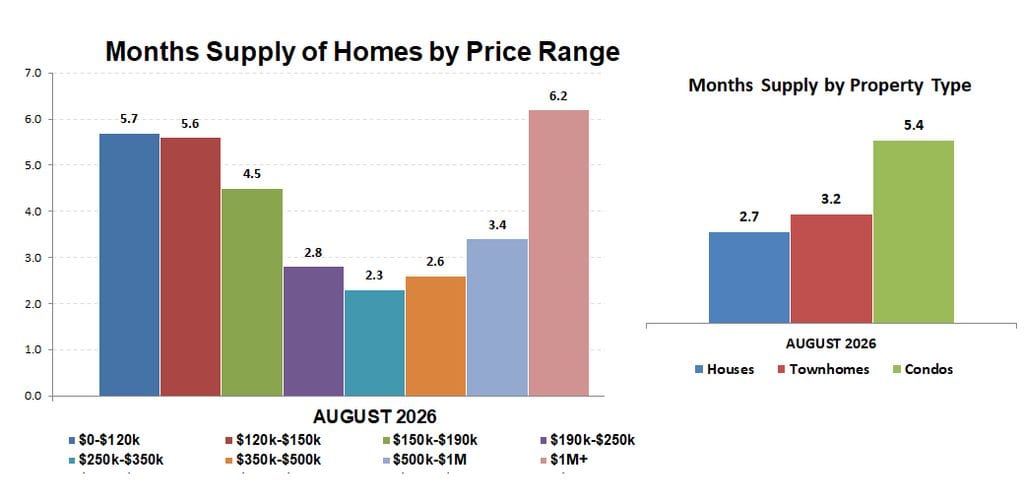
Months supply of inventory, which measures not just the number of homes for sale but also the rate at which they are selling was the same as in July, but increased 7.1% over August 2026 to 3.0 months… still inching its way up to a balanced market of 5-6 months.
Looking at the supply of homes by price range, $250k-$350k continues to be in lowest supply, but all price ranges $150k up to $1M are also in seller’s market range. It’s interesting that both the low range under $150k and the upper range over $1,000,000 have moved into buyer’s market range. Condos continue to have the highest months supply, but townhouses are inching up.
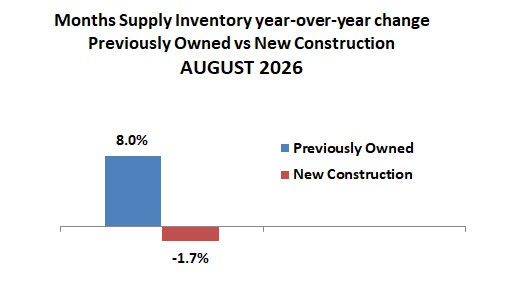
The supply of previously owned homes has increased over last year, while more new construction homes have been selling this year, causing a reduction in supply compared to last year.
The figures above are based on statistics for the combined 13-county Twin Cities metropolitan area released by the Minneapolis Area Association of Realtors.
Never forget that all real estate is local and what is happening in your neighborhood may be very different from the overall metro area.
Check with your Realtor for information on what is happening in your neighborhood.
Sharlene Hensrud, RE/MAX Results – shensrud@homesmsp.com
RELATED POSTS