
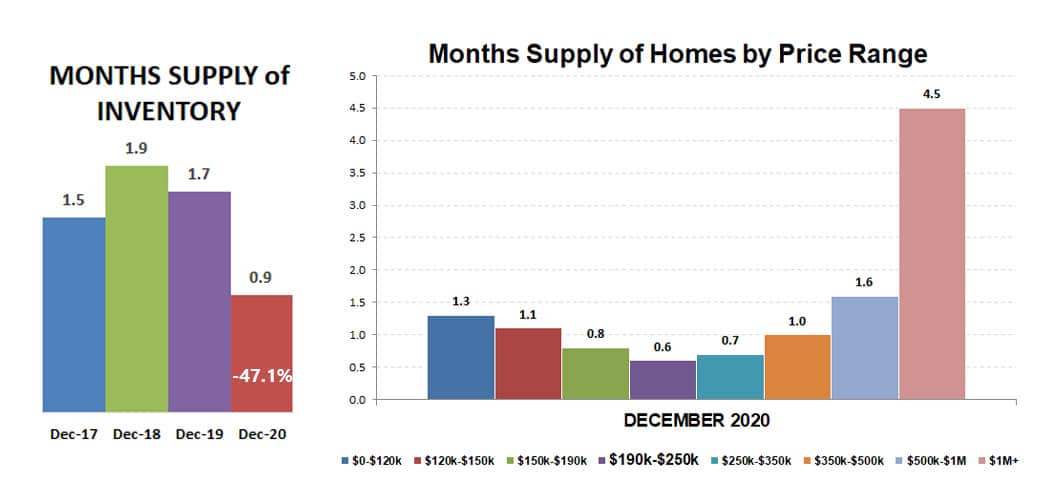
December 2020 inventory dropped 39.3% behind December 2019. But even more dramatic was the overall months supply, which also takes into account how quickly properties are selling. Overall months supply of inventory dropped 47.1% to 0.9 months… the lowest ever.
An even bigger shocker is months supply of inventory by price range. The market is considered balanced between buyer and seller when there is a 5-6 month supply. ALL prices ranges were below this level, indicating a seller’s market for all price ranges, even for homes priced over $1,000,000! I have never seen this before, in 21 years in the industry.
With sale prices rising, it is pushing demand into higher price ranges. No longer are properties less than $150k in highest demand… first time homebuyers are now being pushed into higher price ranges, with highest demand in the $150k-$350k price ranges, which all had less than a one-month supply. All price ranges under $1M had less than a 2-month supply of homes available for sale at the end of December 2020.

New listings were up 22.1% compared to last year, although about 1,000 below new listings last month, which had only a 1.3% year-over-year increase. This is the time of year that new listings usually drop, not increase. But the new listings still couldn’t keep up with sales, resulting in a drop of 39.3% in inventory compared to December 2019. You can see in the charts below what a significant drop this is… inventory is a historic low!

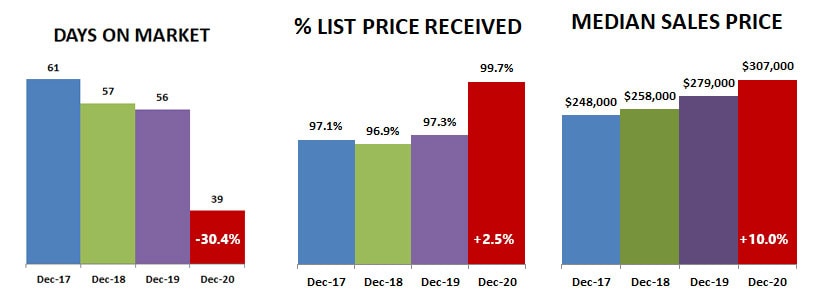
Fierce competition for homes on the market resulted in a strong drop in days on market before pending, down to 39 days. After five straight months of average sales higher than list price, December dropped to an average sale price 99.7% of list price… still not a ‘deal’, as median sale price increased again to 10% over last December. Average sale price for December 2020 was $307,000.
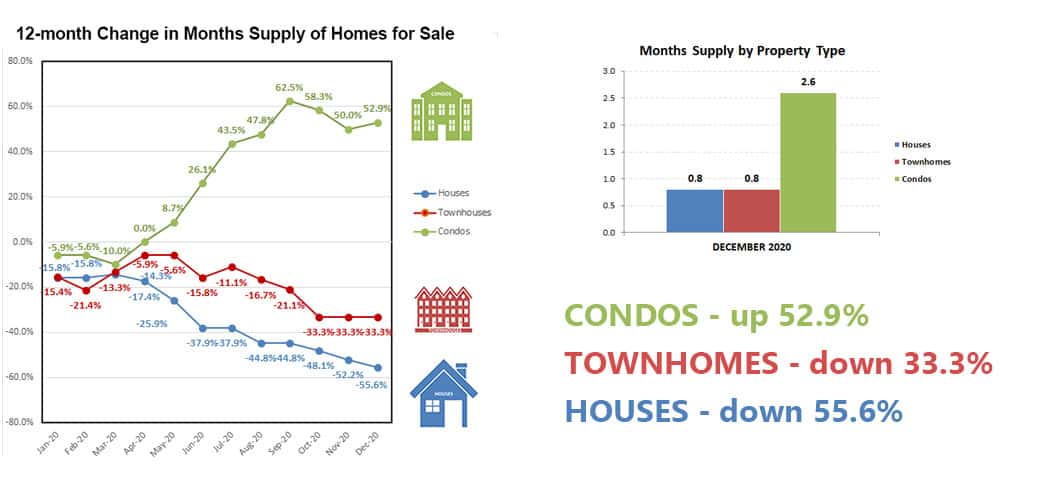
Months supply of inventory is different for different property types, the highest for condos at 2.6 months, with houses and townhouses at 0.8 months supply. The change in condo supply has been rising for most of the year, while townhomes and single family houses have been dropping. Much of this change can be attributed to Covid and the desire to leave the close proximity of condos both inside and outside and move into more space found in houses and townhouses.
The figures above are based on statistics for the combined 13-county Twin Cities metropolitan area released by the Minneapolis Area Association of Realtors.
Never forget that all real estate is local and what is happening in your neighborhood may be very different from the overall metro area.
Click here for local reports on 350+ metro area communities
Sharlene Hensrud, RE/MAX Results – shensrud@homesmsp.com
RELATED POSTS


