
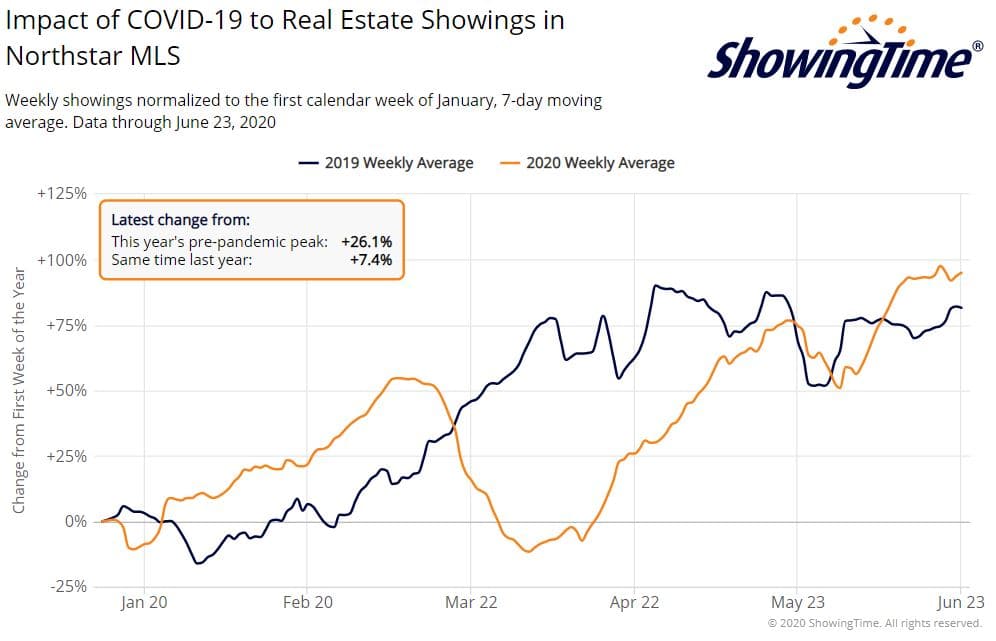
The effects of the shutdowns due to the coronavirus continue to trickle forward… remember, there is typically a 3-6 week period where buyers are seriously looking at homes before securing an agreement, then another 6-8 week period from offer to closing. There was a pent-up demand by prospective buyers, reflected in a dramatic increase in showings after the stay-at-home orders were lifted as you can see in the chart below with stats through June 23, 2020. That, and the supply shortage, likely also resulted in buyers making decisions more quickly.
These showings resulted in an increase of 6.2% in pending sales compared to last year, compared to a decrease of 12.9% last month. Unfortunately new listings couldn’t keep up and experienced a 14.6% drop below last year, but still better than the 22.4% drop in May. All of this resulted in a 29.8% drop in total homes for sale.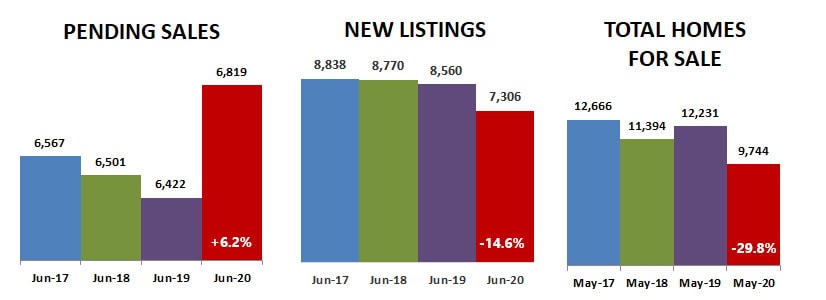
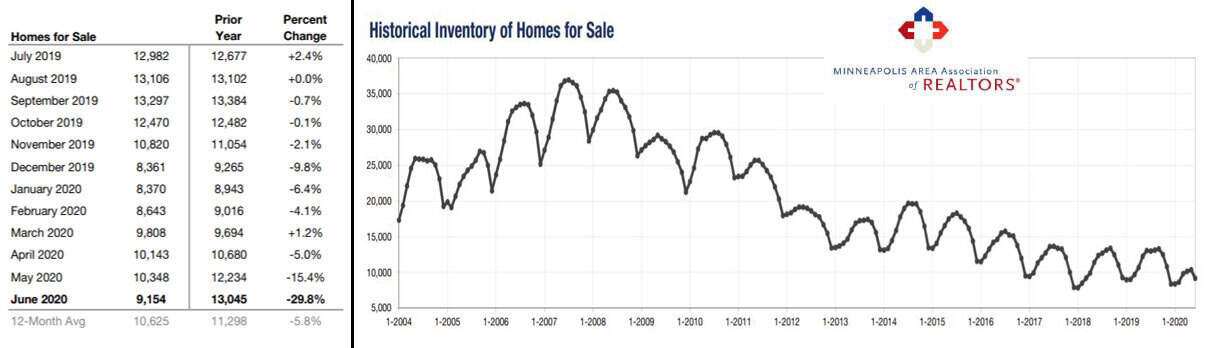
A drop in inventory of nearly 30% in June 2020 compared to June 2019 is significant, but looking at inventory over the last year puts it into even stronger perspective. June’s decrease was about double that of May, which was about triple that of April! After finally making headway with a modest increase in supply of homes for sale in March we are backsliding, making it a better than ever time for sellers to be listing their homes for sale.
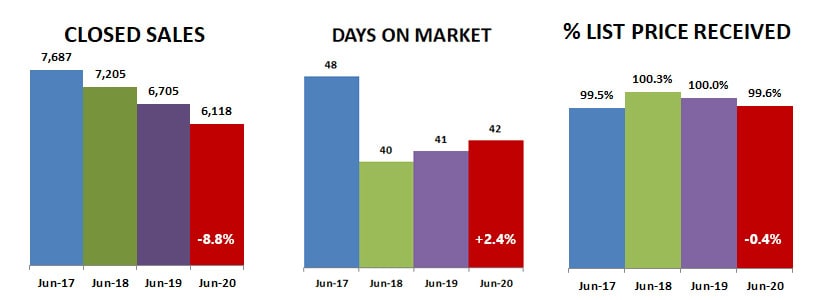
Closed sales were down in June 2020, reflecting the drop in pending sales in April and May due to coronavirus sequestering. Days on market rose only by one day compared to last year, at 42 days on the market before pending sale. Although percent of list price received dropped, it only fell by 0.4%… from 100.0% last year to 99.6% this year, still reflecting high competition for homes.
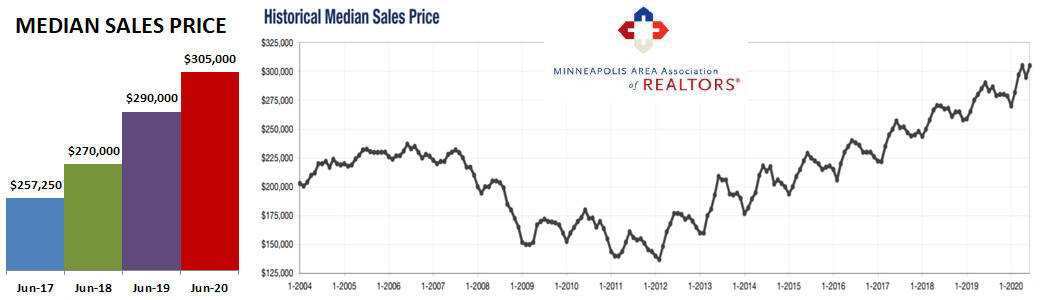
This high competition fueled a continued rise in median sale price, which rose back up to the April 2020 median sales price of $305,000 after dropping to $294,900 in April.
What I continue to see as the best indicator of the real estate market is the months supply of homes for sale, which takes into account not only the supply but also the rate at which buyers are purchasing them. The market is considered balanced when there is a 5-6 month supply of homes for sale.
The only 1.8 months supply of inventory at the end of June was a whopping 33.3% below June 2019, when there was a 2.7 month supply. Even that indicated a seller’s market, but a supply of less than 2 percent is usually reserved for the dead of winter.
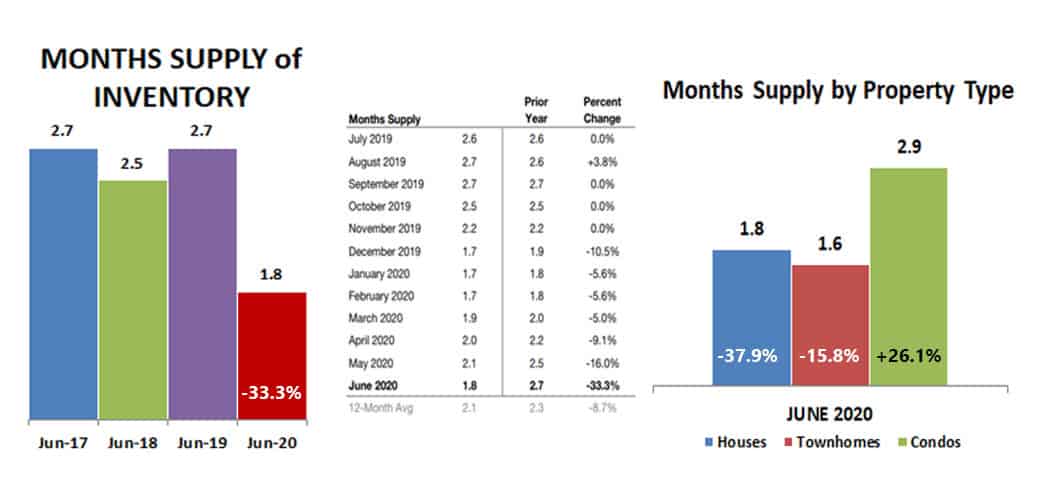
What stands out to me as an even more significant change was the 26.1% increase in the supply of condos for sale. Not since 2011 has the annual condo supply been significantly higher than that of houses, and much of the time it was lower.
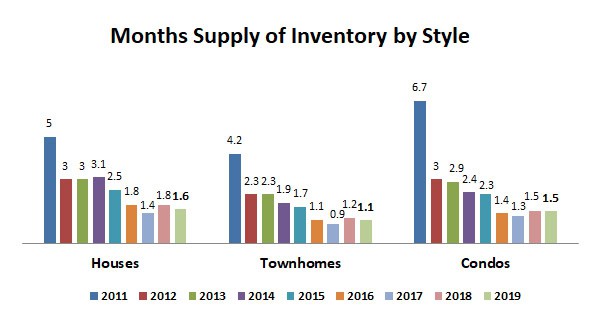
This year started pretty much the same as previous years, with the months supply of both houses and condos staying pretty close together at 1.6-1.8 months. Then in April the condo supply started to increase. It went up again in May, then in June months supply of houses went down to 1.8 months while the supply of condos went up to 2.9 months… that is a spread of 1.1 months supply after being very close for about about 8 years!

This seems to indicate a new trend away from buyers choosing condos… perhaps reflecting a buyer priority shift of selling their condos and moving to houses and suburbs and the country for more space.
Buyer priority shift… top features buyers want since COVID
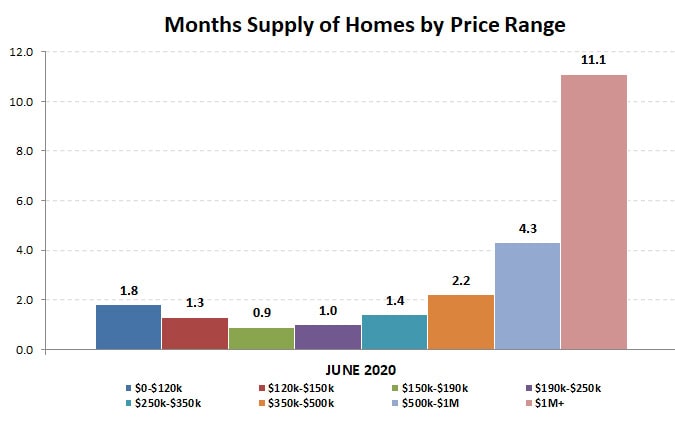
The price range that sold the quickest was $190k-$250k and the price range with the largest gain in sales was $350k-$500k. Sellers take note… it is a seller’s market all the way up to $1M… competition is fierce because of the inventory shortage!
The data in this post comes from statistics released by the Minneapolis Area Association of Realtors. Never forget that all real estate is local and what is happening in your neighborhood may be very different from the overall metro area.
Click here for local reports on 350+ metro area communities
Sharlene Hensrud, RE/MAX Results – shensrud@homesmsp.com
RELATED POSTS
- Real estate market update 7/10/2020… housing affordability index is high
- Market update 6/26/2020… homebuyers are in the mood to buy today
- May 2020 real estate market update… feeling the effects of the COVID-19 shutdown
- Real estate market update June 12, 2020… showings shoot up, are foreclosures coming?
- Is this a good time to sell my house? YES!!! Let me tell you a story…


