
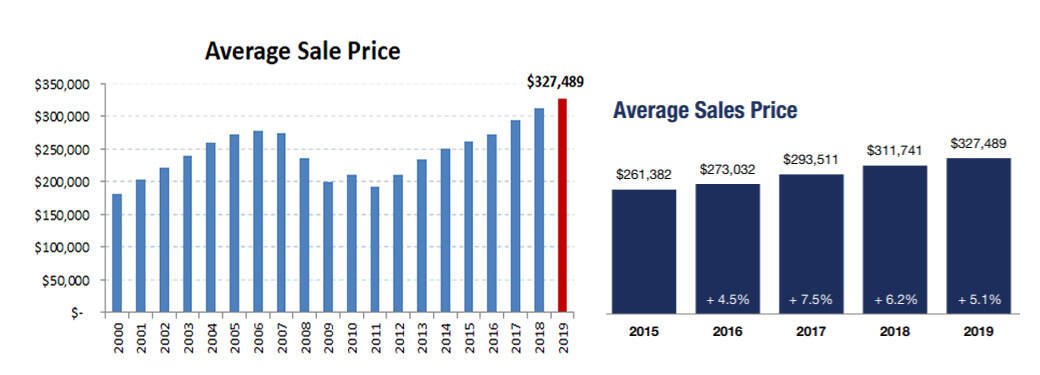
The 2019 Twin Cities housing market was again marked by low inventory, bidding wars and rising prices. Although prices have been rising steadily since 2011, the increase has slowed the last two years with 2019 showing a 5.1% increase in average sales price over 2018.
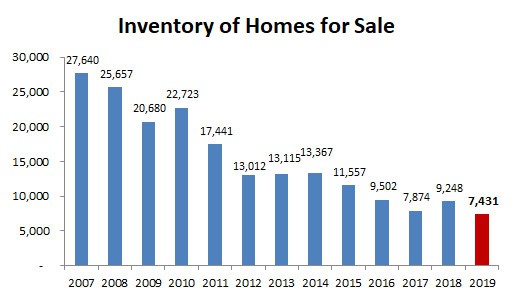
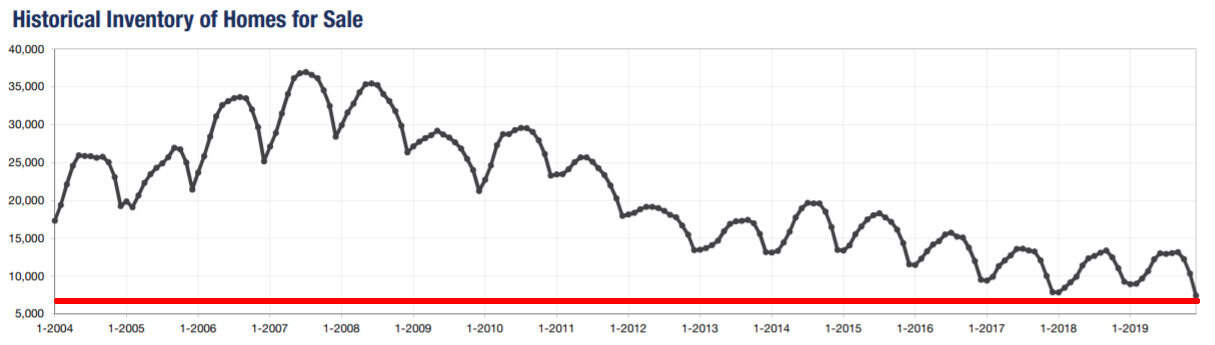
After a welcome rise in inventory in 2018, it fell again in 2019, to the lowest level since records dating back to 2004.
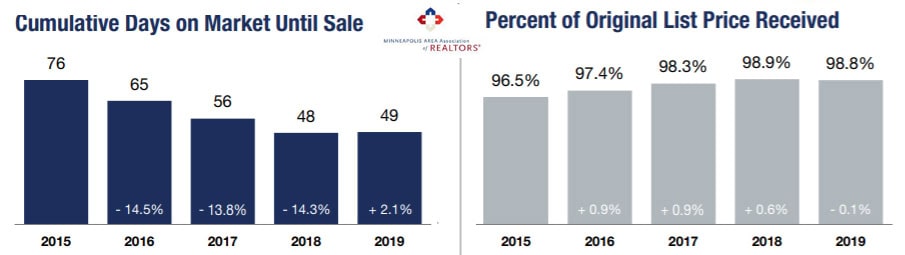
This resulted in a continued low number of days on market before sale at 49 days and a high percent of list price received, at 98.8%.
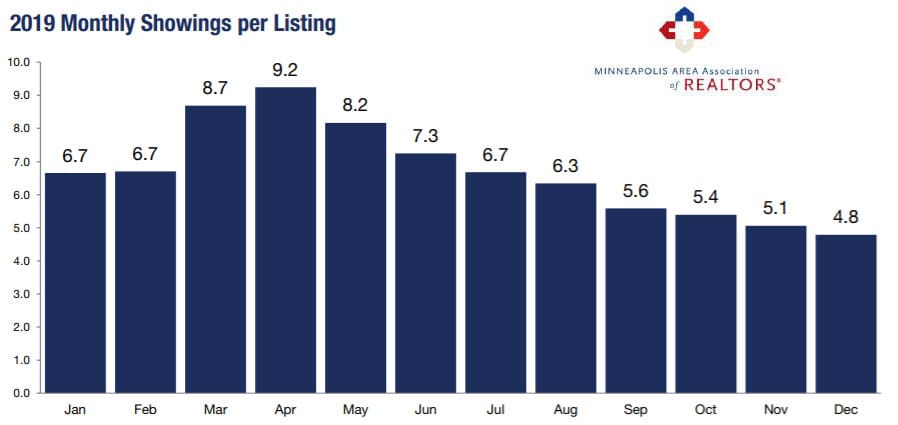
Average monthly showings followed a typical overall trend… except that February held back to the same as January, likely due to record snowfall in February. Activity peaked in April. There was an average number of 14 showings before pending.
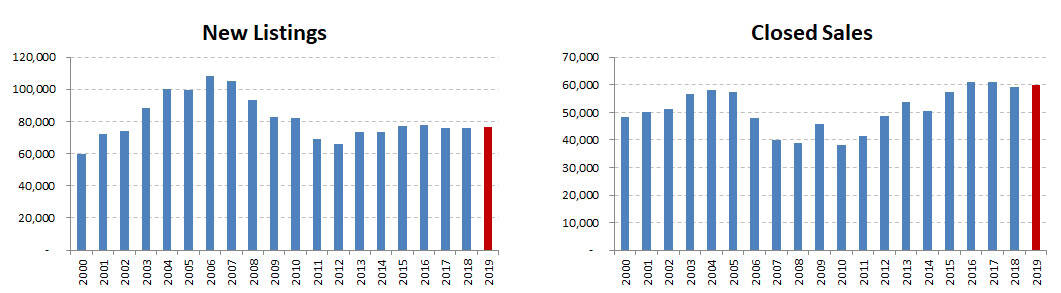
New listings and closed sales showed little change over the previous year, both increasing less than 1%.
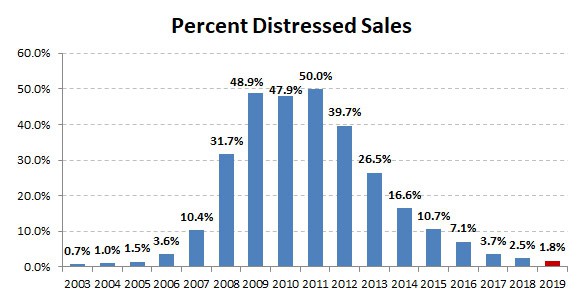
Distressed sales continued to drop, at 1.8% of all sales it is the lowest level since 2005. No wonder buyers ask if distressed sales are included in MLS listings… there simply aren’t many.
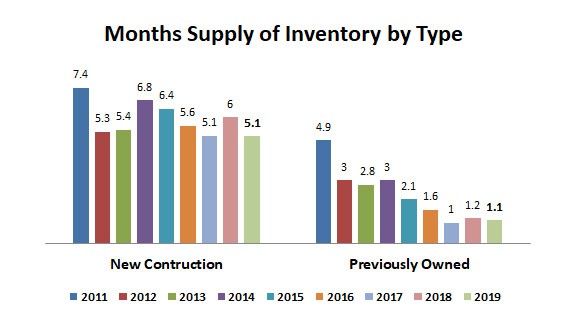
Perhaps the best indicator of the state of the market is months supply of inventory, because it takes into account both supply and demand. The market is considered balanced when there is a 5-6 month supply of homes for sale. At the end of December 2019 it was a strong seller’s market in all price ranges below $1M.
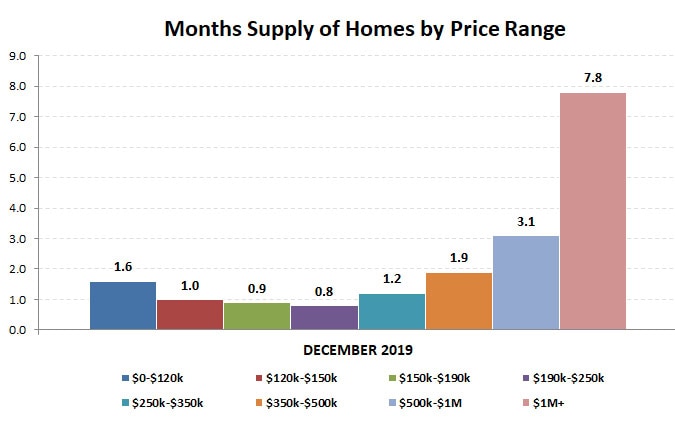
Supply varies not only by price but also by what kind of construction you are looking for. At the end of 2019 new construction was at the low end of balanced between buyer and seller, but previously owned homes had a severe shortage, with only a 1.1 month supply.
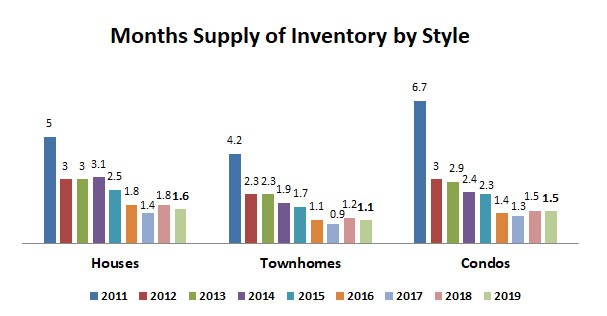
Supply also varies by style, but not as severely. Supply has dropped significantly since 2011.
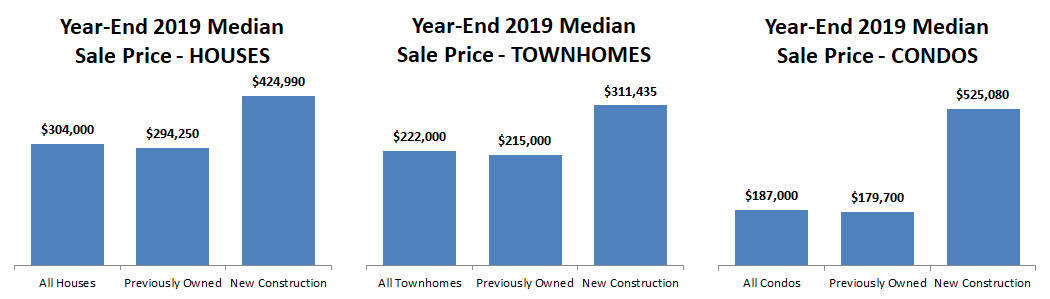
Different styles of homes also have distinctly different median sale prices, with new construction condos having the highest median sale price.
The figures above are based on statistics for the combined 13-county Twin Cities metropolitan area released by the Minneapolis Area Association of Realtors.
Never forget that all real estate is local and what is happening in your neighborhood may be very different from the overall metro area.
Click here for local reports on 350+ metro area communities
Sharlene Hensrud, RE/MAX Results – shensrud@homesmsp.com


