
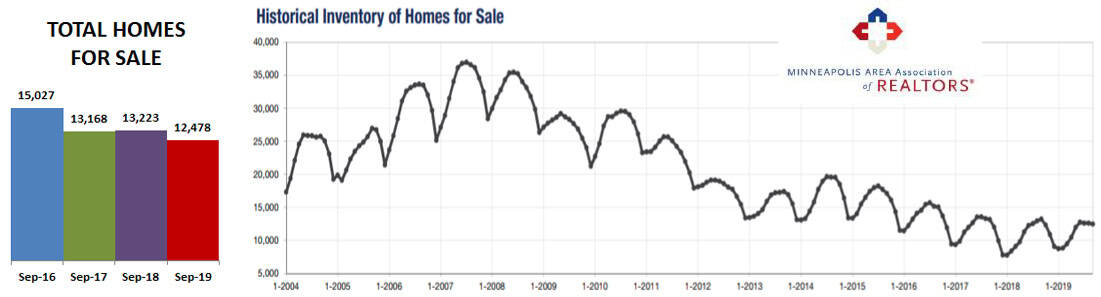
Inventory fell again in September 2019, 5.6% compared to last year. But what strikes me most about the chart above is how the inventory arc is different this year… it didn’t drop as low as previous years at the end of last year/beginning of 2019 and it climbed only until June, then leveled off. It will be interesting to see how the arc continues to the end of the year.
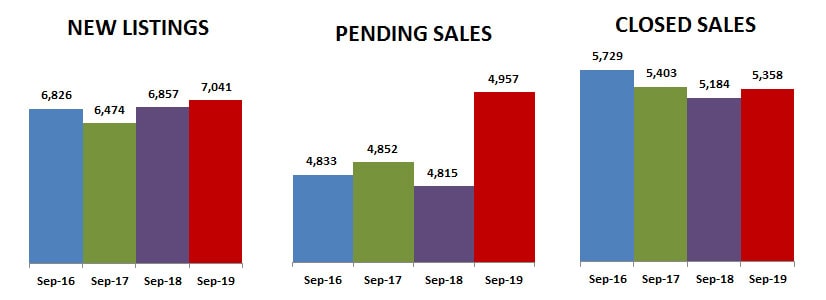
New listings increased 2.5%, but pending sales increased even more at 2.9% while closed sales increased even more at 3.4%… so it isn’t surprising that overall inventory fell 5.6%.
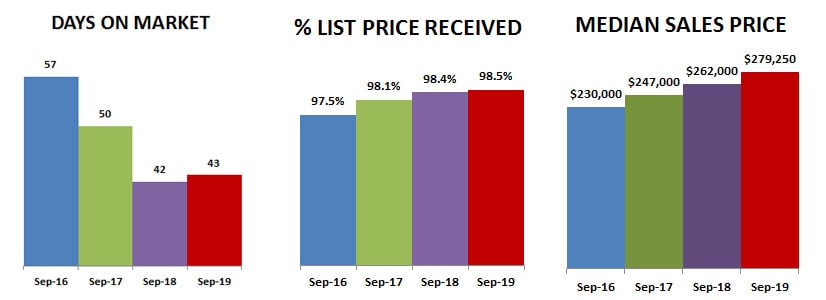
Days on market increased by 2.4% and percent of list price was up only 0.1%… less than in the height of the market season but still strong. Median sales price increased 6.6% to $279,250… again softening compared to earlier months as we move into fall but still ahead of last year.
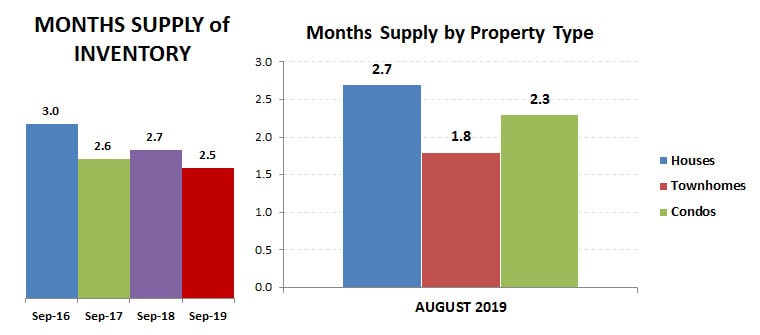
Months supply of inventory dropped 7.4% compared to last September, the biggest drop of all the metrics. With only a two-month supply it is still a strong seller’s market. Townhomes continue to be in shortest supply.
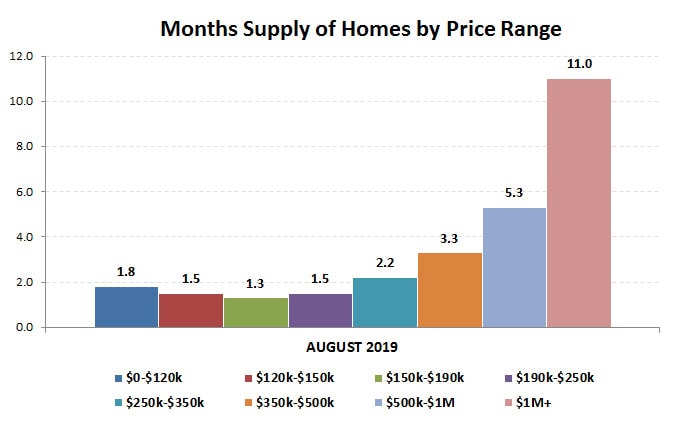
Looking at the market by price range, price ranges under $250,000 still have less than a 2-month supply, and although it is less competitive for price ranges from $250k-$350k it is still a sellers market. The market for homes in the $500k-$1M price is fairly balanced between buyers and sellers. It is a buyer’s market for homes over $1M, with less than a one-year supply.
The figures above are based on statistics for the combined 13-county Twin Cities metropolitan area released by the Minneapolis Area Association of Realtors.
Never forget that all real estate is local and what is happening in your neighborhood may be very different from the overall metro area.
Click here for local reports on 350+ metro area communities
Sharlene Hensrud, RE/MAX Results – shensrud@homesmsp.com
RELATED POSTS


