
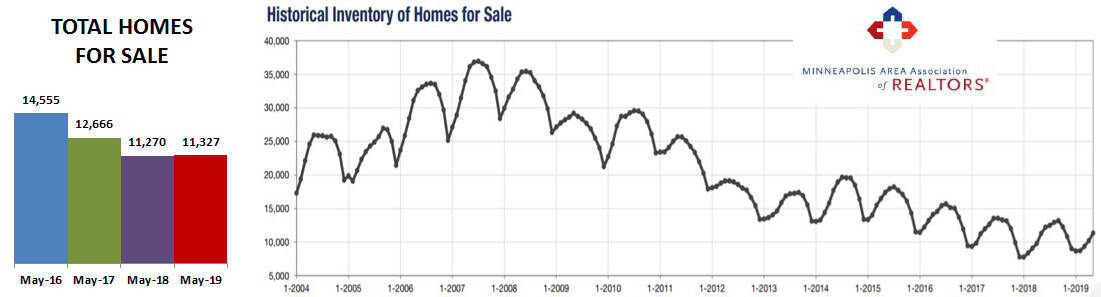
After years of falling inventory it is refreshing to see nine straight months where total inventory is more rather than less than the prior year. Granted, May 2019 was only 0.5% more than May 2018 but it is still a positive rather than a negative change!
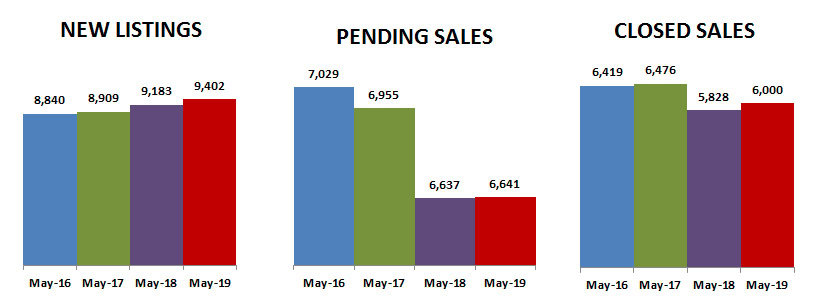
It only follows that new listings must be increasing, up 2.4% over last year… but sales are gobbling them up keeping overall inventory increases low.
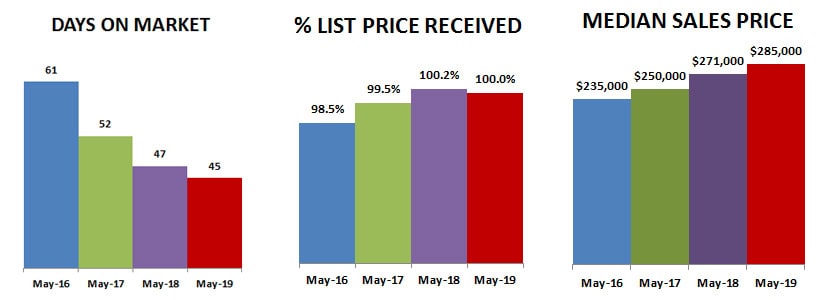
Days on market until sale are down 4.3% compared to last year, rebounding after our weather-impeded March and April. Percent of list price received in May was exactly 100%. It only follows that median sales price continues its slow, steady rise up 5.2% over last May.
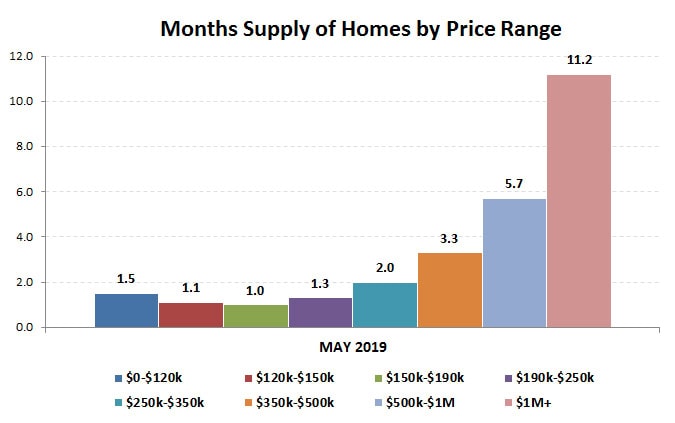
Overall months supply of inventory is the same as it was last year, at 2.3 months (market is considered balanced at 5-6 months)… with supply of single family houses slightly higher and condos slightly lower. Townhomes continue to be in shortest supply.

Months supply improved a little in all price ranges, but there is a 2-month or less supply in all price ranges under $350,000.
Lower interest rates have been welcome news for buyers who continue to keep demand high.
The figures above are based on statistics for the combined 13-county Twin Cities metropolitan area released by the Minneapolis Area Association of Realtors.
Never forget that all real estate is local and what is happening in your neighborhood may be very different from the overall metro area.
Click here for local reports on 350+ metro area communities
Sharlene Hensrud, RE/MAX Results – shensrud@homesmsp.com
RELATED POSTS


