
Housing supply is best measured when comparing the number of homes for sale to the number of sales, which is how we get months supply of inventory. This is the number of months it would take for all the properties to be sold if no new listings came on the market and properties continued to sell at the same rate. It is considered a balanced market when there is a 5-6 month supply of homes for sale.
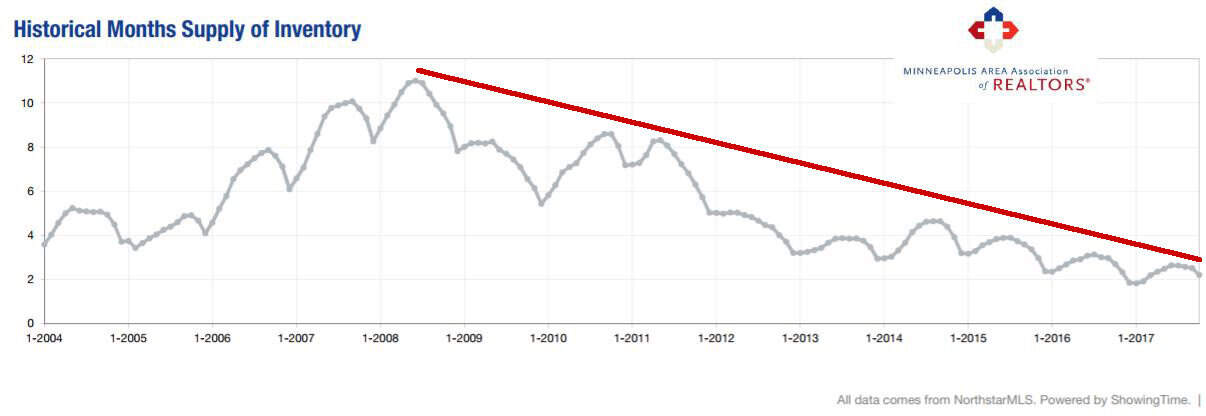
The Twin Cities months supply of homes for sale at the end of October 2017 was 2.2 months, 18.5% below last year and a strong seller’s market… but this is nothing new. The inventory supply has trended downward since its peak at 10.6 months in 2008, when it was a strong buyer’s market. The supply fell somewhat sporadically until 2014 when it settled into a more consistent declining pattern. It has been a seller’s market for several years now.
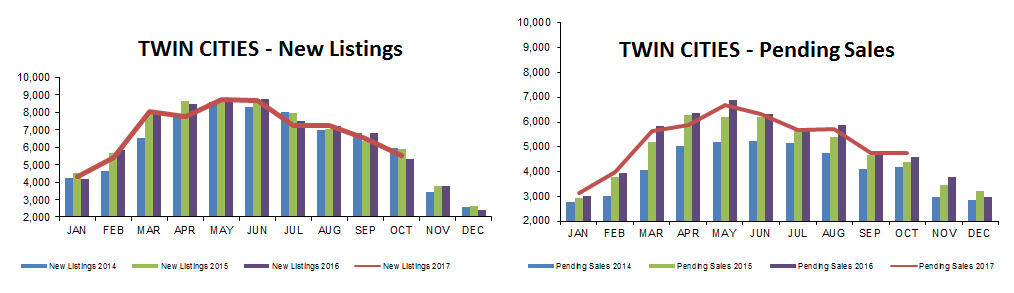
It is interesting that new listings managed to be 3.1% over last October. Unfortunately, they lagged behind an average of 2.1% for the rolling year, including by 5.2% in September. October 2017 pending sales were 3.9% ahead of last year, eating up that increase in new listings.
It isn’t surprising that the laws of supply and demand continue to drive prices up… to $244,000 and 6.1% ahead of last October. Days on the market dropped by 14.8%, to an average of 52 days.

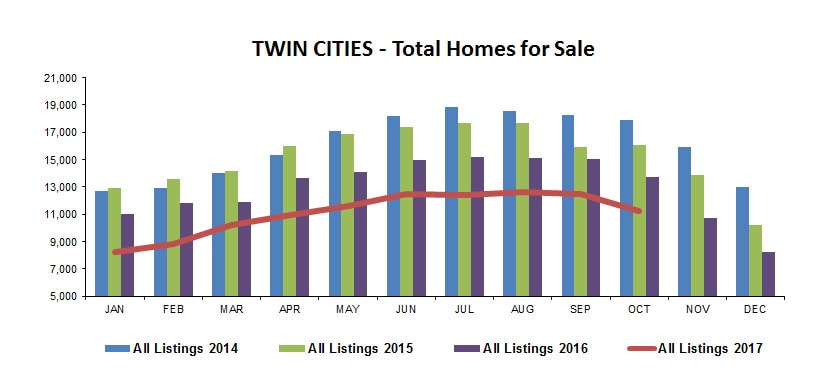
The chart below shows how persistently the total inventory of homes for sale has been hanging low, with this October 18% below last October 2016, which was 15% below October 2015.
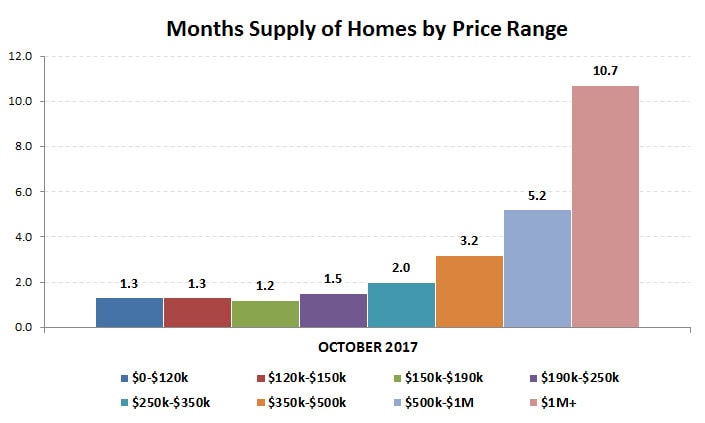
The months supply of inventory does vary depending on price range, with price ranges under $250,000 all having only a 1.5 month supply or less. Only price ranges over $1M are in a buyer’s market with a 10.7 month supply.
Townhouses continue to be the housing type with the lowest supply.

The national unemployment rate was 4.1 percent in October, the lowest it has been since December 2000. With mortgage rates holding steady near 3.9 percent, about half the average rate of 8 percent since 1970, buyers are still in steady supply.
The figures above are based on statistics for the combined 16-county Twin Cities metropolitan area released by the Minneapolis Area Association of Realtors.
Never forget that all real estate is local and what is happening in your neighborhood may be very different from the overall metro area.
Click here for local reports on 350+ metro area communities
Sharlene Hensrud – Email – Minneapolis – St. Paul Real Estate Market
RE/MAX Results HomesMSP Team- Sharlene, John, Angela – Minneapolis-St. Paul Realtors
RELATED POSTS


