
According to the National Association of Realtors (NAR), US existing home sales across the US increased 5.1% month-over-month and 1.4% year-over-year in January, the strongest pace in nearly three years. In contrast, pending sales were down 9.1% from the previous month and 3.0% year-over-year.
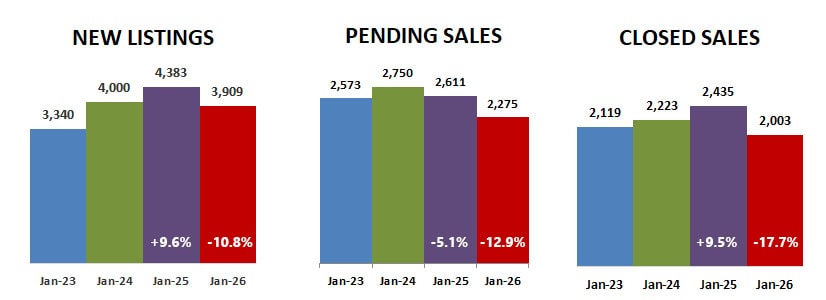
In the Twin Cities market, new listings, pending and closed sales were all down more than 10% compared to last year. We have no way of knowing how much of this was impacted by the ICE activity in the Twin Cities in January.
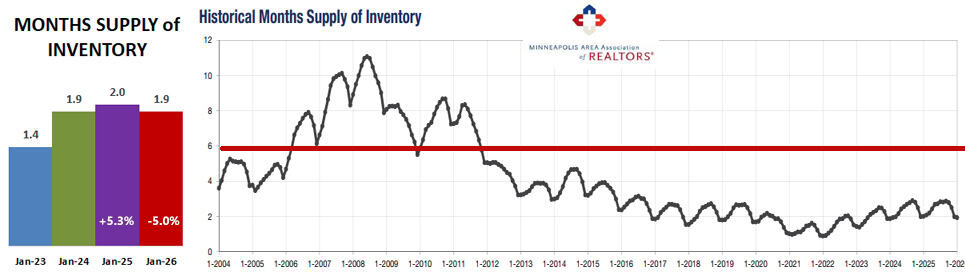
Months supply of inventory, which reflects not only the total supply of homes for sale but also the rate at which they are being sold, fell 5.0% year-over-year and was the same as it was in December 2025 at 1.9 months… still a low supply.
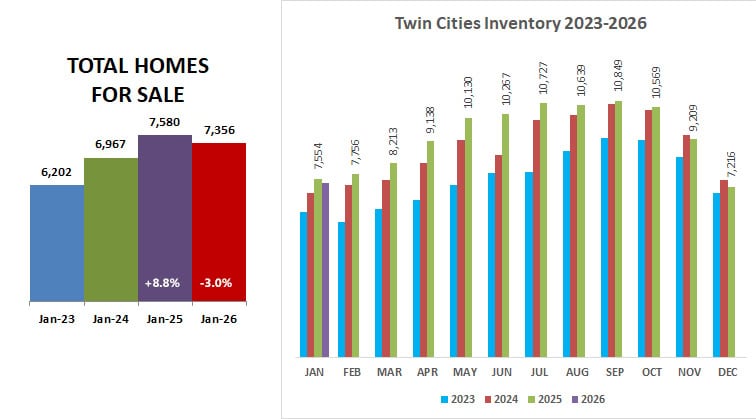
Total homes for sale fell year-over-year for the third month in a row and the first time January inventory was lower that the previous January since 2022.
Days on market before pending actually fell year-over-year, as median sales price continued to rise.
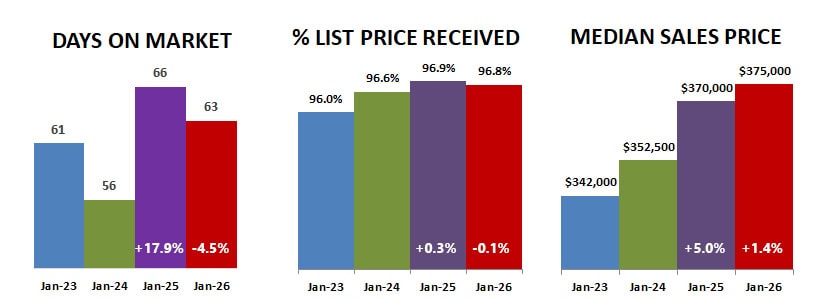
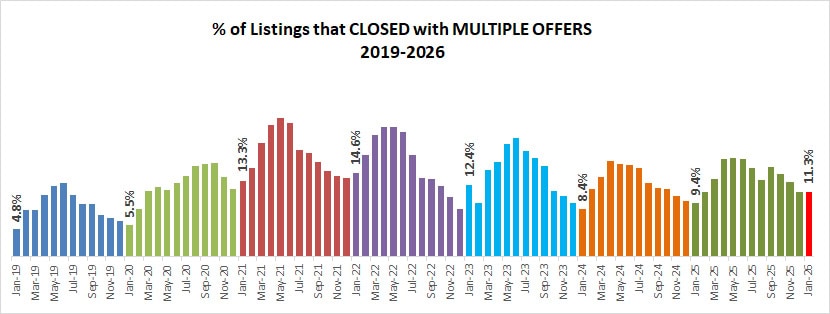
Multiple offers were ahead of the last two years, and the same as in December 2025 at 11.3% of sales closing with known multiple offers. This helped keep the percent of list price received relatively strong at 96.8% of list price and median sales price at $375,000.
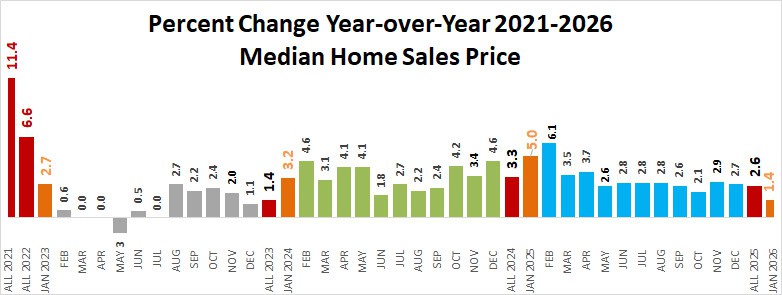
However, the increase in median home sales price was only 1.4% over last January, the lowest it has been in recent years and the same as it was for all of 2023, the year interest rates increased.
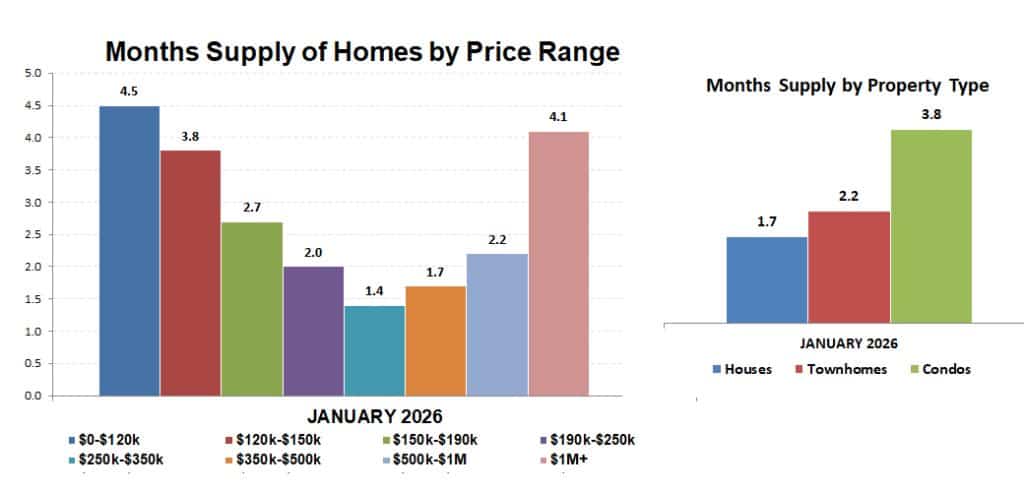
Months supply by price range again has a bigger supply of homes in the the lowest price range than the highest, with only a 4.1 month supply of homes priced over $1,000,000. Condo supply is again over twice that of houses.
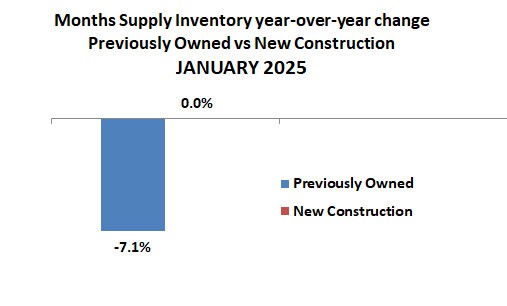
Change in months supply of new vs previously owned home was interesting… there was no change for previously owned homes vs a 7.1% increase in new construction.
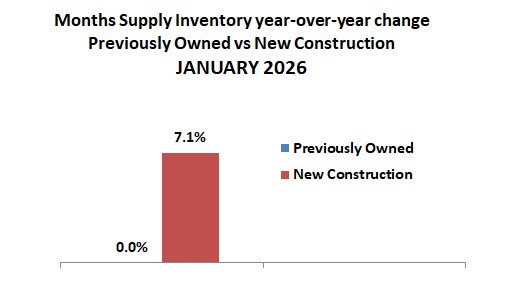
What is really interesting is how this is the inverse of January 2025, when there was no change in new construction inventory vs a 7.1% drop in previously owned home inventory.
The figures above are based on statistics for the combined 13-county Twin Cities metropolitan area released by the Minneapolis Area Association of Realtors.
Never forget that all real estate is local and what is happening in your neighborhood may be very different from the overall metro area.
Check with your Realtor for information on what is happening in your neighborhood.
Sharlene Hensrud, RE/MAX Results – shensrud@homesmsp.com
RELATED POSTS


