
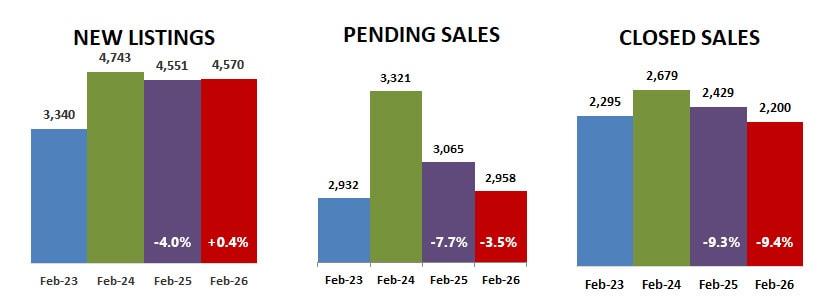
New listings inched up compared to last year in February, but only by 0.4%… as pending sales fell 3.5% and closed sales fell 9.4% compared to last year, even more that US sales that fell 8.9%.
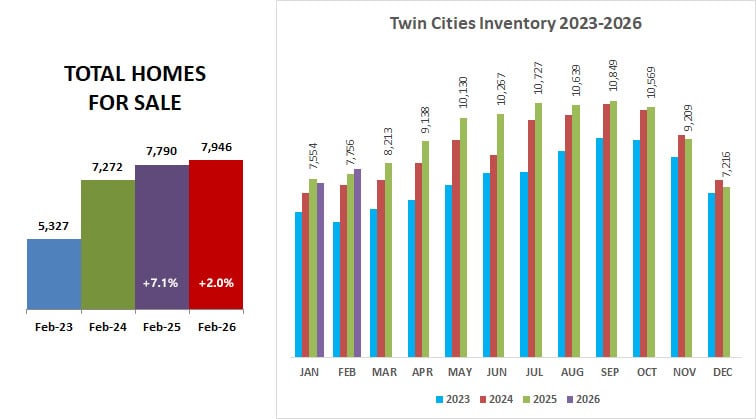
One would expect the inventory to increase with sales going down and new listings increasing… which it did by a modest 2%. After falling behind the previous year for the last 3 months, having a month where inventory was higher than last year is welcome… let’s hope it continues.
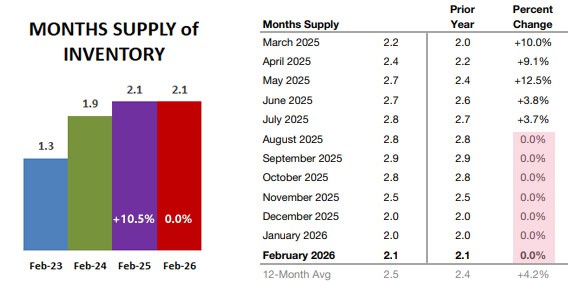
What caught my attention was the months supply of inventory… not only was February the same as the previous February… it was also stagnant with 0% year-over-year change in January, December, November, October, September and August! (Months supply of inventory is how many months it would take sell the current supply at the current rate with no additional listings.)
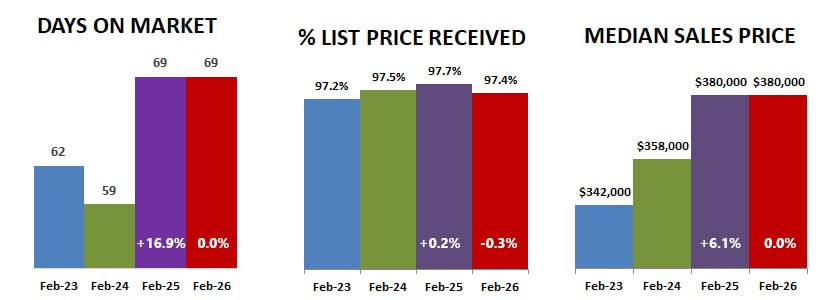
Then I saw that year-over-year stats for Days on Market and Median Sales Price were also the same as last February… is the market stagnating?
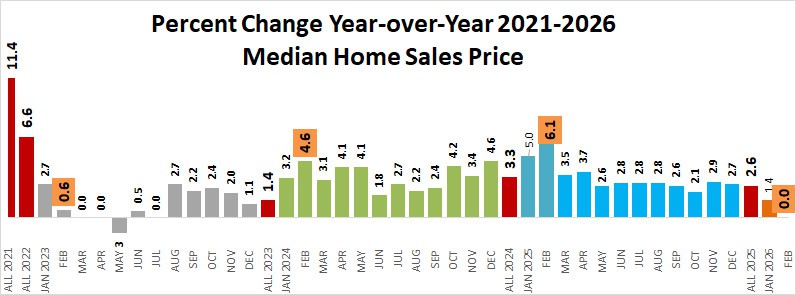
Monthly year-over-year sales price change hasn’t been at zero since 2023… the year mortgage interest rates leaped up. Many states showed negative growth in sales prices that year, but the Twin Cities averaged out the year better than many with a 1.4% increase.
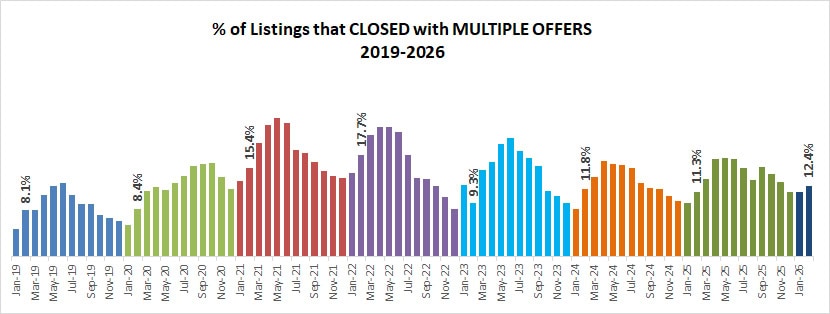
The percent of trackable listings that closed with multiple offers was still strong at 12.4%… competition that kept average sales prices at 97.4% of list price, only 0.3% below last year. But offers crazy high above list price are no longer the norm as they were in 2021 and 2022. That said, properties in good condition in a demand location still command strong prices.
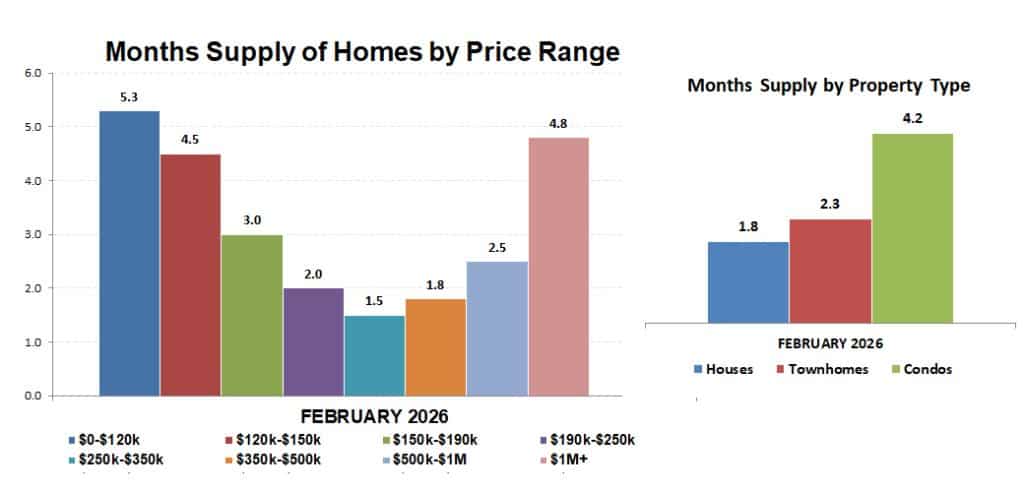
Once again, properties in the $250k-$350k price range have the shortest supply at 1.5 months, and the lowest price has the highest months supply of homes for sale at 5.3 months. It is a seller’s market in all price ranges, even over $1,000,000 which has a 4.8 month supply. Condos have the largest supply of the property types at 4.2 months, single family houses the lowest supply at 1.8 months.
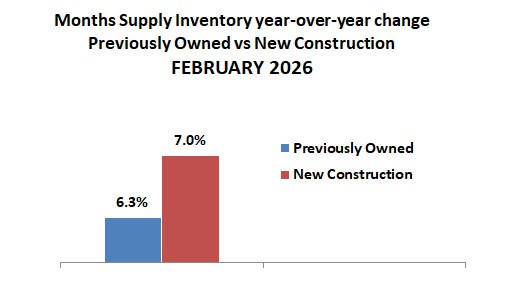
The supply of new construction has increased 7.0% over February 2025, the number of previously owned homes for sale increased 6.3%. Even though inventory has increased slightly, it still isn’t enough to keep up with demand. Reuters reports that over a decade of underbuilding has created a persistent, severe shortage, causing home prices to far outpace income growth and severely limiting affordability for buyers.
The figures above are based on statistics for the combined 13-county Twin Cities metropolitan area released by the Minneapolis Area Association of Realtors.
Never forget that all real estate is local and what is happening in your neighborhood may be very different from the overall metro area.
Check with your Realtor for information on what is happening in your neighborhood.
Sharlene Hensrud, RE/MAX Results – shensrud@homesmsp.com
RELATED POSTS


