
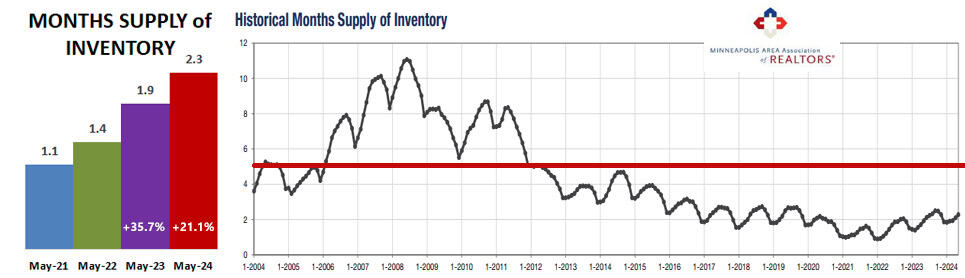
In May 2024 Twin Cities inventory of homes for sale rose 15.7% over May 2023, to 8,614 homes for sale. But months supply of inventory rose even more… a 21.1% rise compared to last year, to a 2.3 months supply of inventory. This means that if sales continue at the same pace with no new listings all inventory would be sold in 2.3 months. Inventory is considered balanced between buyer and seller with a 5-6 month supply (red line in the graph below). The supply of homes for sale is improving but we still have a long way to go to get to a balanced market. It is still a seller’s market.
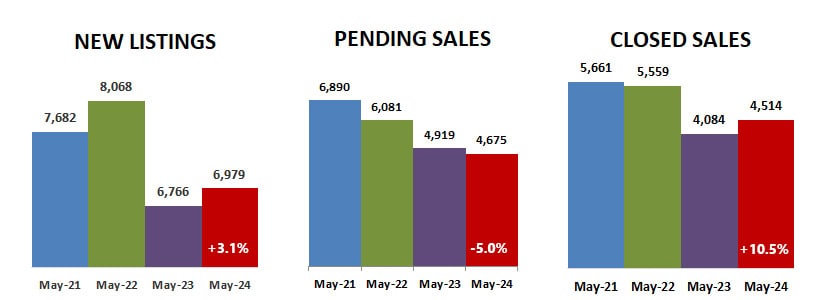
New listings and closed sales were both up in May, but pending sales were down… indicating closed sales could also be down next month. The National Association of REALTORS reported that US sales were down in all regions of the country for the second month in a row. Our pending sales were up last month but down this month… time will tell what the future brings.
Days on the market before pending were up, and although percent of list price received was lower than last year, it was still the first time it reached 100% this year.
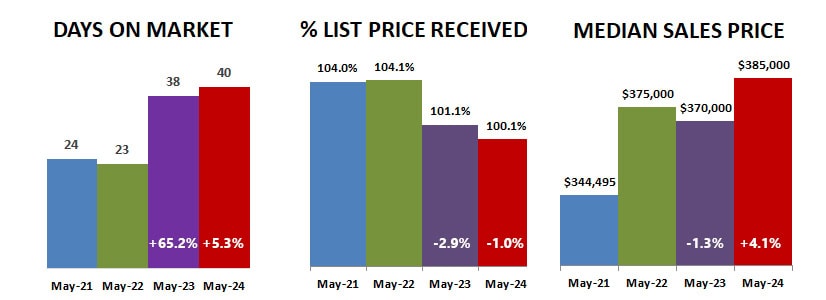
It may seem like everything is selling over list price, but the overall average percent over list price has softened. List price is indicated by the line in the graph below.

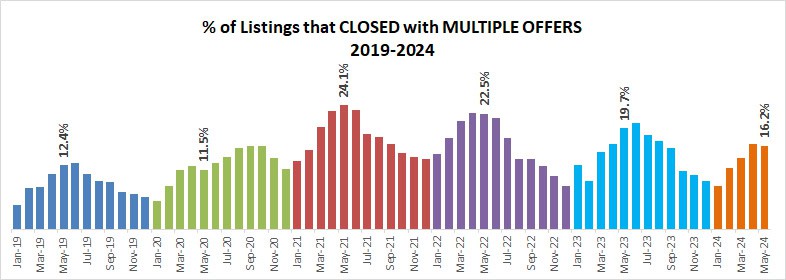
There are still multiple offers, can be intense on some properties, but overall the percent of multiple offers is also softening, with fewer in May than in April this year.
Multiple offers help support sale prices over list price… which in turn support rising median sale prices. It is interesting to note that April median sale price took a big jump over March, but April and May 2024 were the same… still the highest sale prices on record.
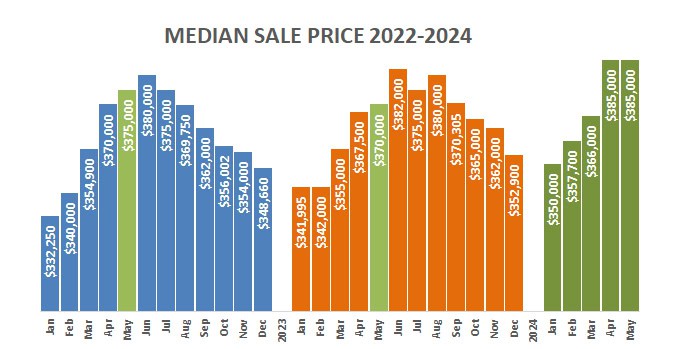
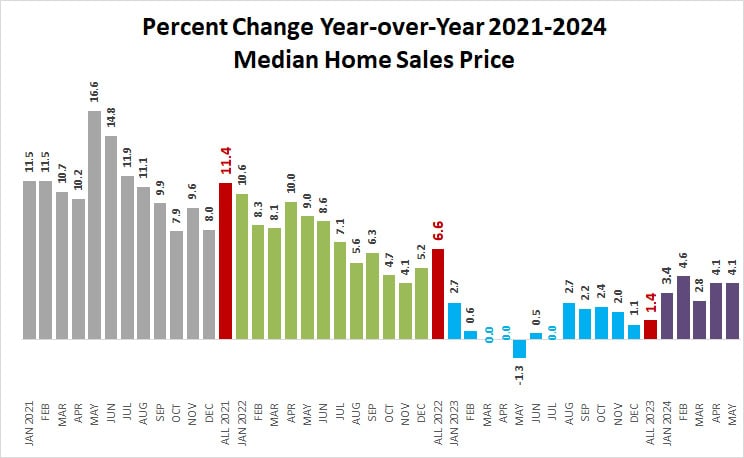
The percent change in median home sales prices year-over-year was the same in April and May 2024… every month so far this year higher than every month last year, which was hit hard by the rise in interest rates.
Looking at months supply of inventory by price range shows an increase in all price ranges, with $190k-$350k having the lowest supply at 1.4 months. Condos are the home type with the biggest supply, at 3.8 months. Single family homes and townhomes are tied at 2.2 months.

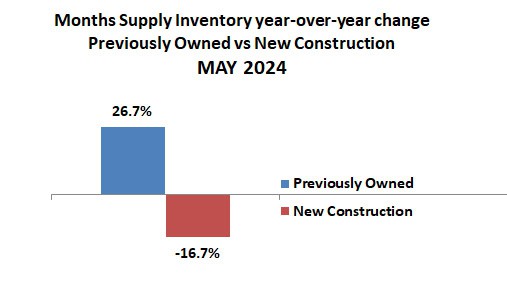
The supply of previously owned homes is up 26.7%, compared to new construction down 16.7% as builders struggle to keep up with buyer demand.
The figures above are based on statistics for the combined 13-county Twin Cities metropolitan area released by the Minneapolis Area Association of Realtors.
Never forget that all real estate is local and what is happening in your neighborhood may be very different from the overall metro area.
Click here for local reports on 350+ area communities
Sharlene Hensrud, RE/MAX Results – shensrud@homesmsp.com
RELATED POSTS


