
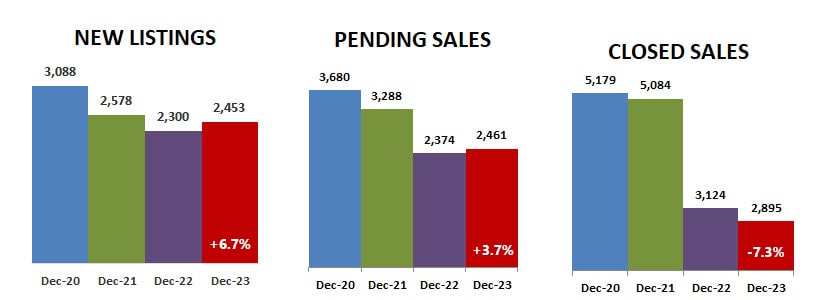
After falling every month since December 2021, new listings and pending sales both ended the year by increasing year-over-year in December 2023. Closed sales have been falling year-over-year even longer, starting in September 2021.
While sales have been falling, months supply has finally been rising year-over-year every month since April 2022. The red line on the graph below represents a balanced market with a supply of about 5 months. Even if this trend continues, we still have a long way to go to get to a balanced market again… we had only a 1.7 month supply of homes for sale the end of December. It has been a seller’s market for more than a decade.

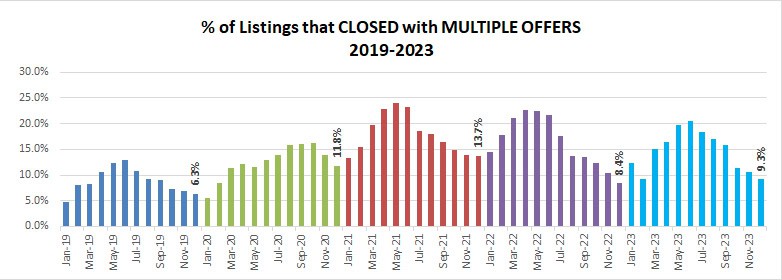
Even though sales have slowed, this inventory shortage has fueled multiple offers, impacting 9.3% of closed sales in December 2023.
These multiple offers made sale prices rise above list price. You can see in the graph below that prices were soaring over listing price last year until interest rates started to rise the last half of the year. As buyers adjusted to the new reality prices started to rise again this year.

Now interest rates are falling again after reaching a two-decade high in October and average list price received is higher than it was last December. Days on market are steady at 50 days, but average median sales price is 1.1% higher than December 2022, at $352,900.

Although we are more insulated in the center of the country and our prices didn’t fall as much as on the coasts and southern border, our prices still were impacted… not as much as some buyers had hoped who were waiting for a crash, but price increases were much lower that the last two years, ending the year at a 1.4% average annual increase over 2022.

There is less than a 2-month supply of homes for sale in all price ranges under $500,000… only a 2.3 month supply in the $500k-$1M price range, and it is still a seller’s market even in the $1M+ price range. Condos are the style with the highest supply.

Supply of previously owned homes has increased 9.1% over last December while new construction supply has decreased 8.8%. With predicted falling interest rates speculation is that new construction will increase in 2023.

The figures above are based on statistics for the combined 13-county Twin Cities metropolitan area released by the Minneapolis Area Association of Realtors.
Never forget that all real estate is local and what is happening in your neighborhood may be very different from the overall metro area.
Click here for local reports on 350+ area communities
Sharlene Hensrud, RE/MAX Results – shensrud@homesmsp.com
RELATED POSTS


