
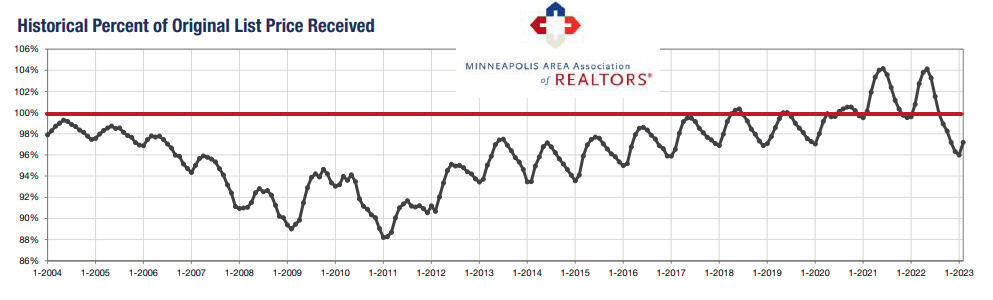
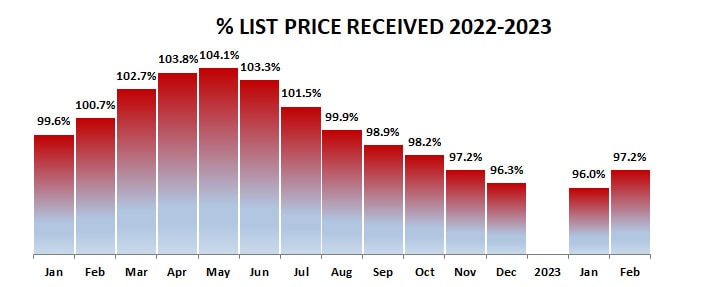
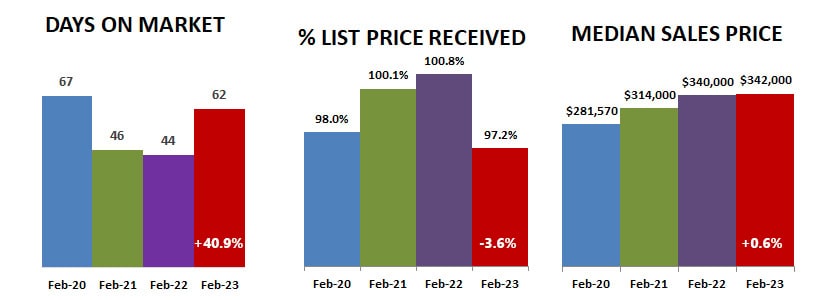
After a record-breaking couple years where list price was like a minimum starting bid price, percent of list price received at sale started falling last August and fell every month through January 2023. This February it increased to 97.2%, the same as it was last November.
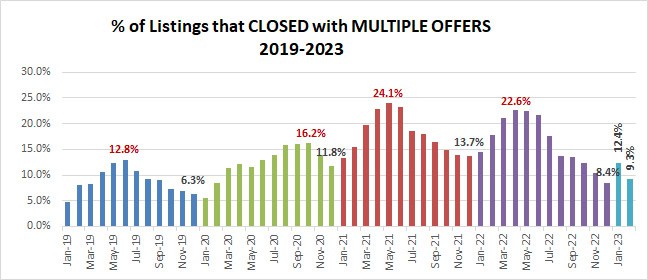
Percent of listings that closed with multiple offers was lower in February than January, but we are seeing a weekly increase in multiple offers again in March, so it will be interesting to see if that results in another increase in average percent of list price received for March.
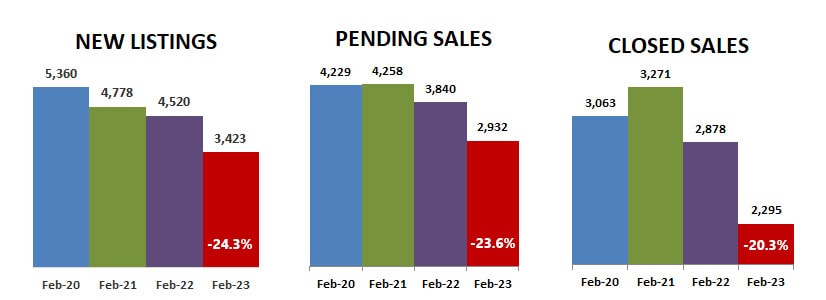
New listings and pending sales dropped more than they did last month, but closed sales dropped less.
Days on market before pending increased to close to what they were right before the pandemic hit in March 2020. Median sales price increased again, but the amount of the increase has really slowed down. February 2023 median sales price of $342,000 is only $2,000 above last February.
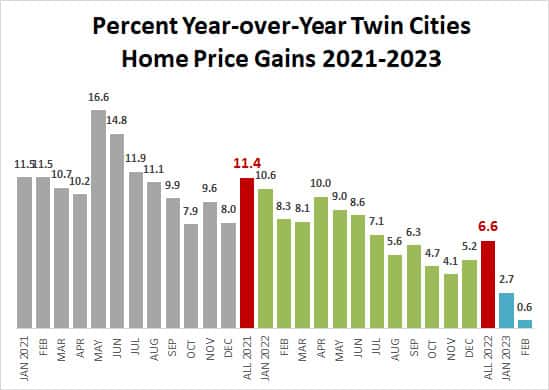
Annual average sale prices have been rising steadily since 2011, with monthly gains especially high the last couple years. At only 0.6%, February 2023 year-over-year price increase was almost nothing compared to what it has been the last two years.
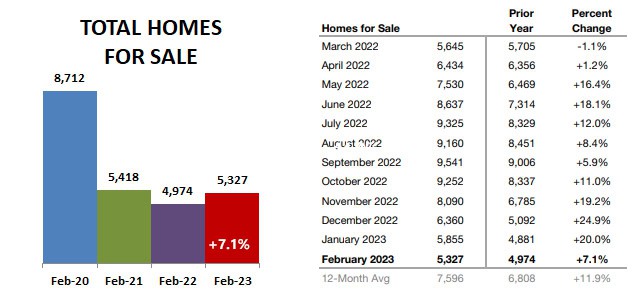
In contrast to years of rising prices, inventory has been falling for years, with total number of homes for sale finally rising in 2022.

Rising mortgage interest rates caused an increase in inventory most months last year as buyers reacted as a new reality set it and some found themselves priced out of the price ranges where they had been looking. February showed the smallest increase in the number of homes for sale since September last year… still the lowest total supply in the last 12 months.
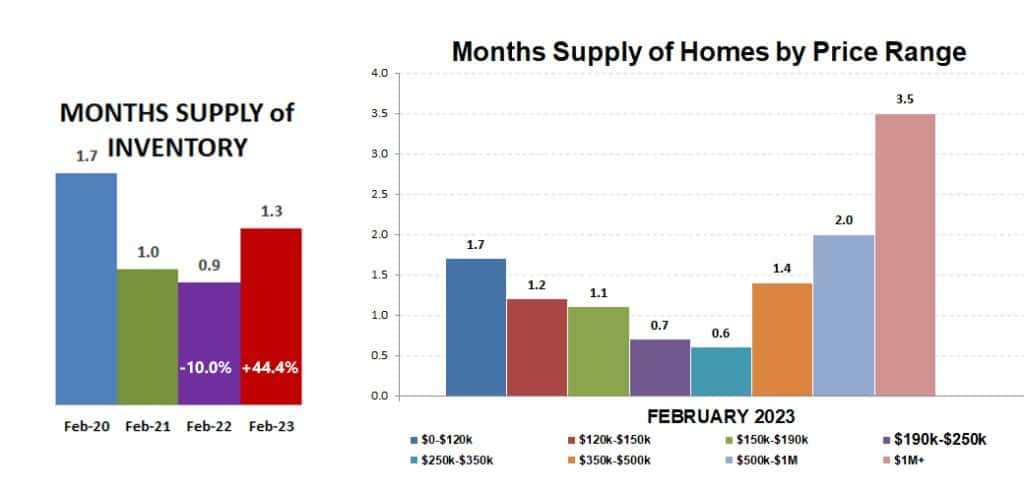
Months supply of inventory (how many months it would take for the current supply of homes to be sold at the current rate) is still low at 1.3 months (the market is considered balanced at 5-6 months), but still 44.4% over last year at this time when the total supply was under one month.
The figures above are based on statistics for the combined 13-county Twin Cities metropolitan area released by the Minneapolis Area Association of Realtors.
Never forget that all real estate is local and what is happening in your neighborhood may be very different from the overall metro area.
Click here for local reports on 350+ metro area communities
Sharlene Hensrud, RE/MAX Results – shensrud@homesmsp.com
RELATED POSTS


