
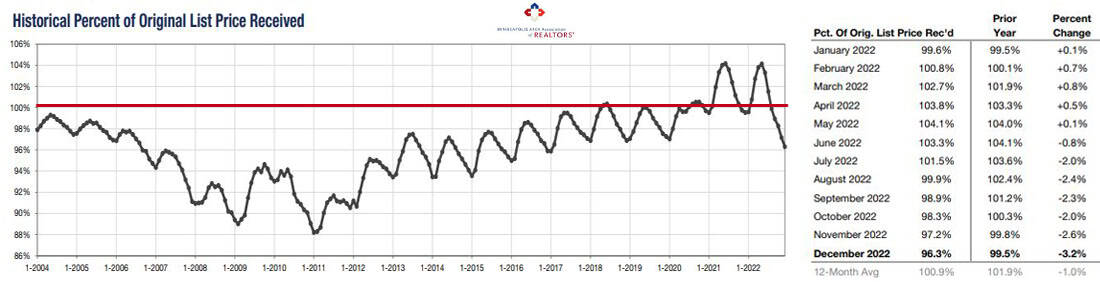
The historical pattern of buying a home has been the seller sets a list price, and the buyer offers a lower price… then they negotiate to a mutually agreeable sales price, usually lower than the original list price. As you can see in the chart above, average sale prices shot up to way over list price the last two years… to the chagrin of beleaguered buyers and the delight of ecstatic sellers. Looking at the historical chart above that goes back to 2004 you can see this is far from normal, and why parental advice on making an offer to buy was often in a fantasy world compared to the reality of the insane market the last two years.
The tail hanging below the 100% line in the chart above illustrates the market shift the middle of 2022. When mortgage interest rates increased, percent of list price received started declining, illustrated in the chart below.
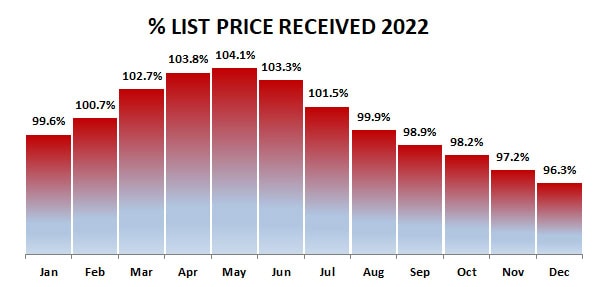
2022 was a tale of two markets… BEFORE and AFTER mortgage interest rates increased. Expect 2023 to be a year of re-adjustment… for both prices and interest rates.

You can clearly see how the pandemic years (2020-2021) were outside the norm in looking at stats across the board. December 2022 numbers are still below 2019, but not as big a plunge as the drop down from 2020 and 2021.

As sales dropped, days on market before pending increased and percent list price received decreased. But don’t think that caused prices to also drop. Demand still caused prices to rise because an inventory shortage persists. The percent of closed listings I found that indicated ‘multiple’ in the listings, although lower than the last two years, was 8.4%… still higher than in 2019.

The drop in number of sales helped the total homes for sale increase over last December, but the months supply of inventory increased 55.6%, to 1.4 months… still a seller’s market but a welcome increase in the supply compared to last year, when it was only 0.9 months. Keep in mind that it is considered a balanced market when the months supply of homes for sale is 5-6 months. We have a long way to go.

Breaking it out by price range, it blows my mind that even prices $1,000,000 plus have only a 3.4 month supply.
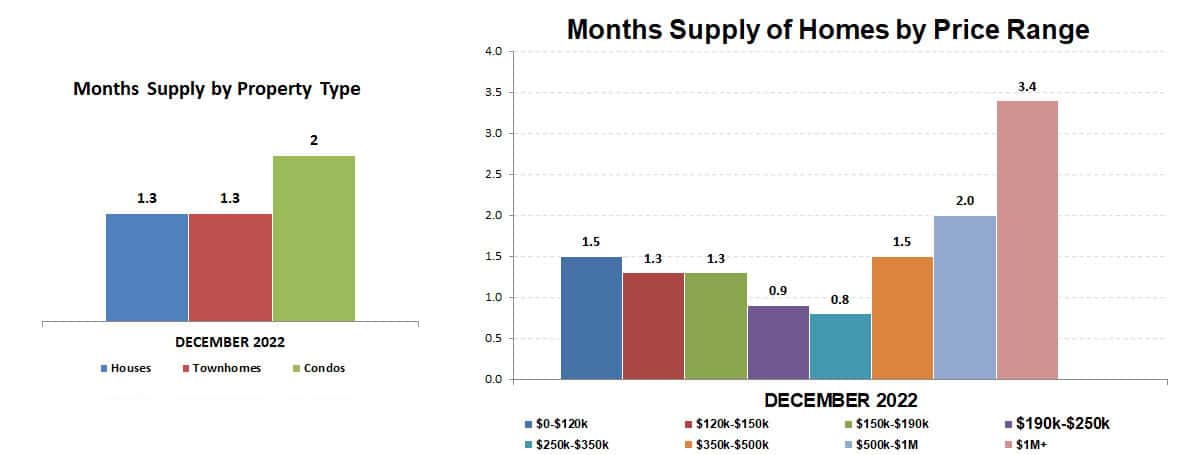
This intense competition for a limited number of homes for sale is what has caused year-over-year prices to continue to rise in spite of declining sales.

Percent year-over-year price gains is 5.2 in 2022 compared to 8.0 in December 2021. Annual price gain was 11.4 in 2021… down to 6.6 in 2022.

The bright spot for buyers is that after years of falling inventory, months supply for both new construction and previously owned properties increased in 2022. With signs mortgage rates may improve at least a little, it will be interesting to see what 2023 brings.

The figures above are based on statistics for the combined 13-county Twin Cities metropolitan area released by the Minneapolis Area Association of Realtors.
Never forget that all real estate is local and what is happening in your neighborhood may be very different from the overall metro area.
Click here for local reports on 350+ metro area communities
Sharlene Hensrud, RE/MAX Results – shensrud@homesmsp.com
RELATED POSTS


