
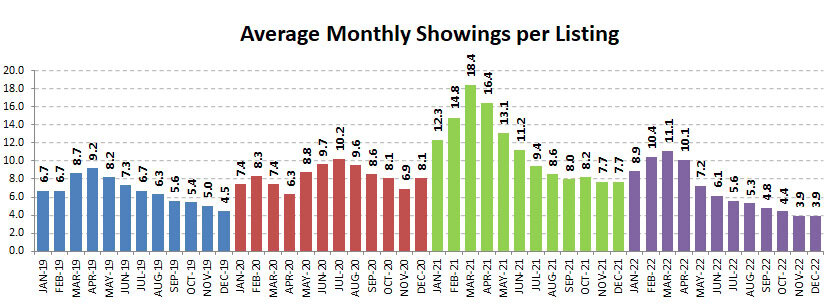
What perhaps illustrates best the frustration that buyers have been feeling over the ‘pandemic’ years is the chart above showing the average number of monthly showings per listing. It is somewhat misleading because in the height of the frenzy the total number of showings often took place in a matter of days rather than spread over the course of a month. The peak was in March of 2021, but 2022 also started strong. Then, as interest rates started rising mid year showings fell in response… ending even lower than in 2019, before the pandemic.
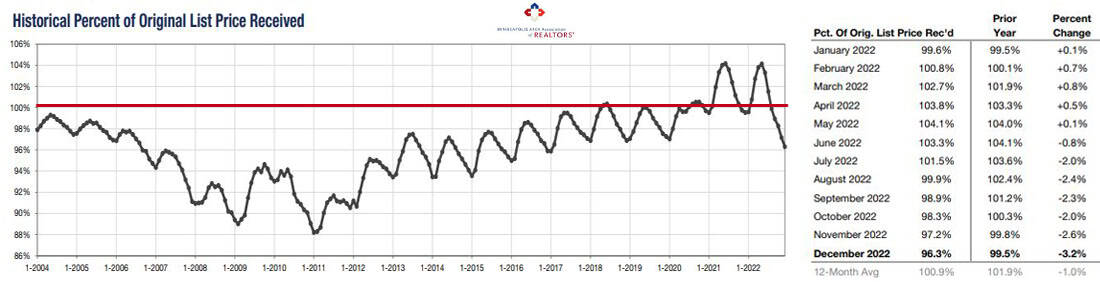
The showing frenzy resulted in multiple offers and the two big humps in the chart below are for average sale prices way over list price in 2021 and the beginning of 2022, peaking in May. The tail at the end, shows how the market fell after mortgage rates started to rise.
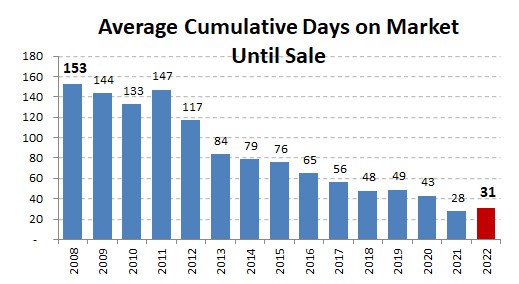
Average cumulative days on market until sale has been falling since 2008, when the average was 153 days. The peak of buying frenzy in 2021 brought it down to 28. The average in 2022 was 31 days on the market, up a little over 2021 because of the market shift the last half of the year.
By the end of 2022, percent of list price received was down to 96.3%, a level not seen since the end of 2016.
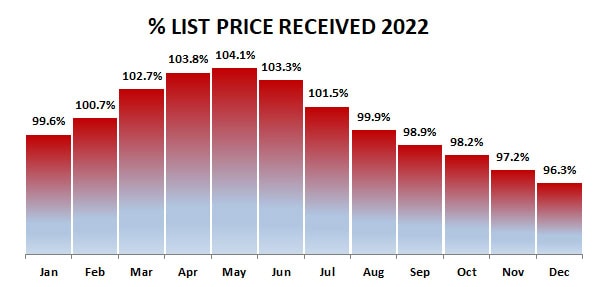
In spite of this change, year-over-year prices increased throughout the year because we still have an inventory shortage.
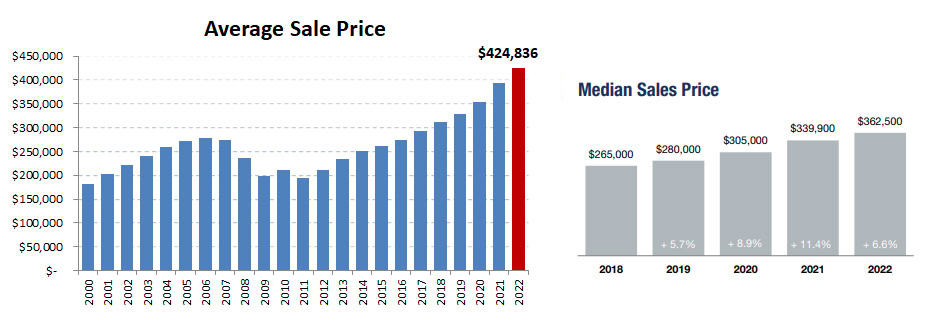
Overall, 2022 sales prices increased 6.6% over 2021… down from 11.4% in 2021. Keep in mind this isn’t sale prices decreasing… it is the INCREASE in sale prices that is decreasing.

To put it all in perspective let’s look at annual totals over the years.
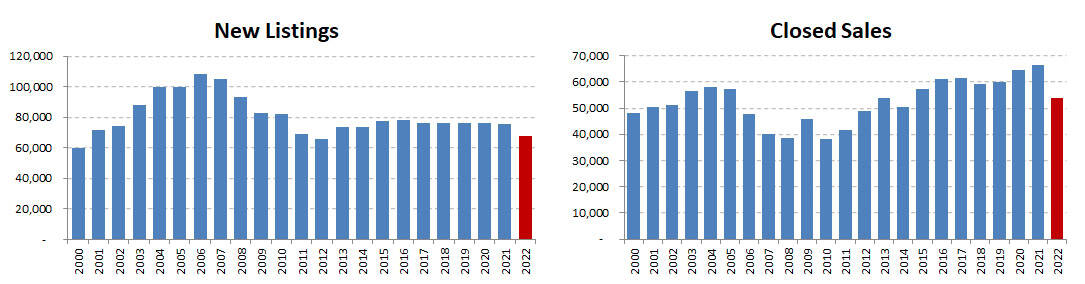
After many years with the number of new listings remaining relatively constant, the total number of new listings fell in 2022. In spite of starting the year strong, the drop in sales in the last half of the year caused the total closed sales for 2022 to fall to a level not seen since before 2015.
Falling inventory has been the bane of the real estate market for a long time. Falling sales caused the total inventory of homes for sale to actually increase a bit in 2022, bringing a ray of hope for beleaguered buyers.

Buyers hoping for bargains from distressed foreclosures and short sales like in 2009-2011 were disappointed. Only 0.7% of sales in 2022 were distressed… back to the level in 2003.

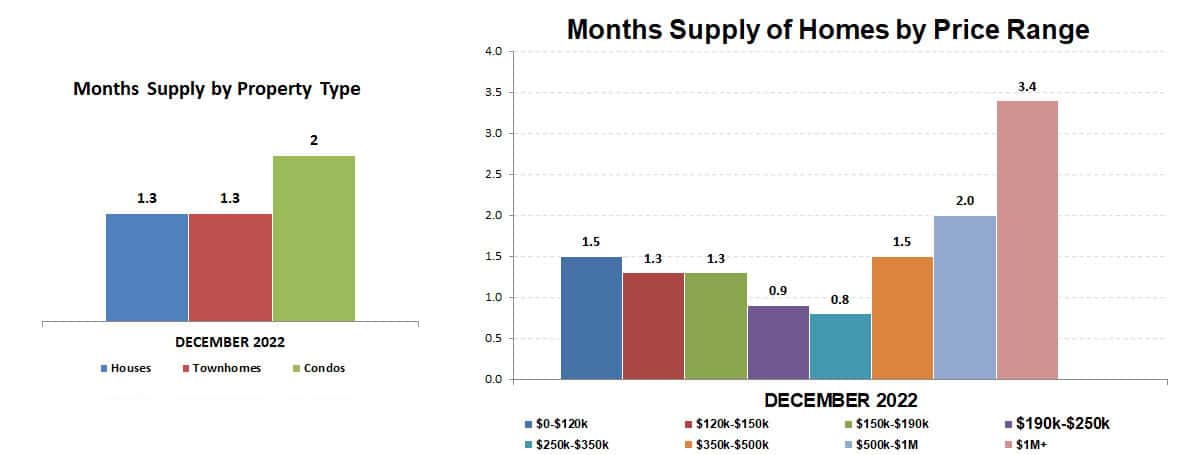
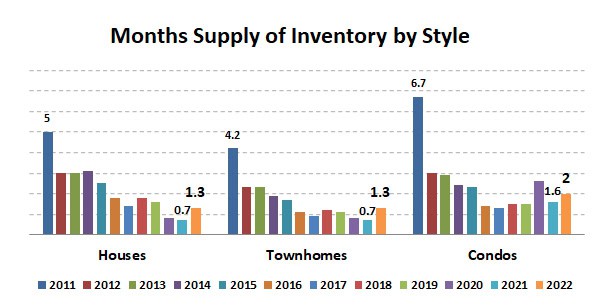
I have long felt that months supply of inventory gives the best sense of the market because it takes into account both supply and demand. It is considered balanced when there is about a 5-6 month supply. 2022 ended the year with a 1.4 month supply overall, broken out by price and property type below.
See the history below since 2011 broken out by type and style. There is a much greater supply of new construction than previously owned homes.
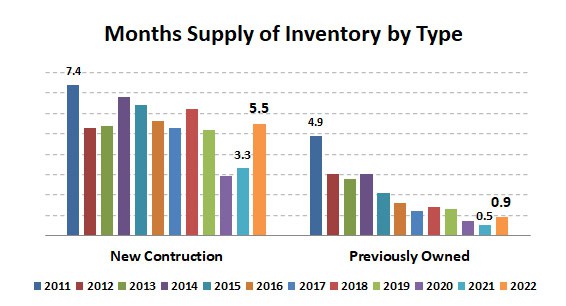
It is encouraging that the 2022 months supply has increased by both style and type compared to 2021.
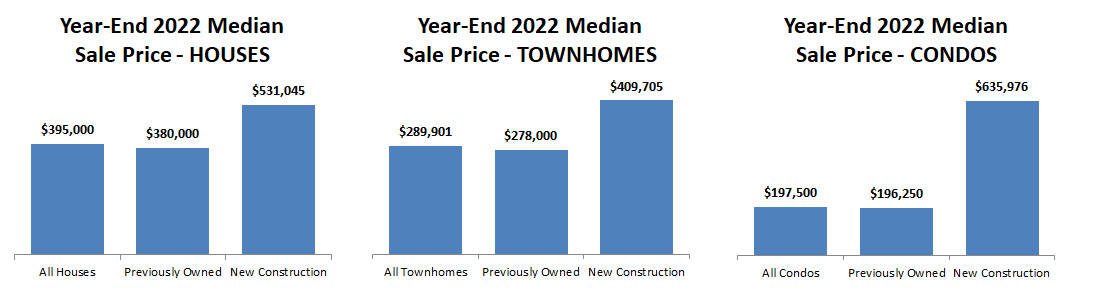
Different types and styles of homes also had distinctly different median sale prices, with new construction condos commanding the highest median sales price.
The figures above are based on statistics for the combined 13-county Twin Cities metropolitan area released by the Minneapolis Area Association of Realtors.
Never forget that all real estate is local and what is happening in your neighborhood may be very different from the overall metro area.
Click for the full Annual Housing Market Report – Twin Cities Metro from the Minneapolis Area Association of Realtors.
Sharlene Hensrud, RE/MAX Results – shensrud@homesmsp.com
RELATED POSTS


