
The big question when buyers found a home they liked the last couple years has been “what is the deadline for highest and best offer?” Competition for great homes in great locations has always yielded multiple offers, but the competition has been insane the last couple years. There is no way to truly track all multiple offers, but listings will often say ‘multiple’ offers in the MLS listing comments, so I used that to at least give an indication.
The number of sales has been diminishing, so to get a more accurate picture of the current story of multiple offers the chart below gives a reflection of the PERCENT of listings that had multiple offers… and to give a more immediate picture, I used pending date rather than closing date, which may take place 4-8 weeks later.

I went back to 2019, which was a more ‘normal’ year… the percentage of listings that had multiple offers followed a curve which peaked in April at 13.7%. In 2020 at the height of Covid it peaked in August at 16.2% of listings. Then it went crazy in 2021, starting in January at 15.3% and peaking again in April, this time at 22.9%. December only dropped to 12.7% of listings with multiple offers. But what is really remarkable is how strong 2022 started… at least 18.6% of January listings had multiple offers. The first part of 2022 was even more competitive than 2021, with this year finally falling behind last year in June and July.
This competition is also reflected in the percent of list price received. In other words, how high sale prices were over asking price. January through May 2022 was ahead of 2021, starting to fall behind in June, more behind in July.


Monthly median sale prices continue to be ahead of last year, but in 2021 prices held steady in June, July and August before declining in fall and winter. In 2022 prices have started to decline already in July.

Month-over-month price gains dropped to 7.1% in July, the lowest so far in 2021 and 2022.

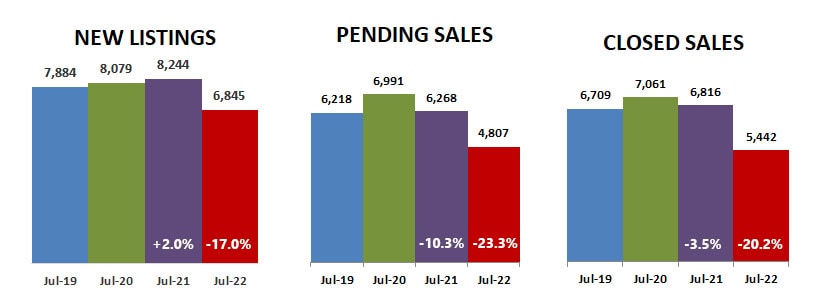
July 2022 new listings were down 17.0% compared to July 2021, closed sales down 20.2% and pending sales down 23.3% forecasting even lower closed sales to come.
Days on market before pending increased by 15.8% in July as percent of list price received dropped but median sales price still increased by 7.1%, the lowest increase in 2021 and 2022.

Months supply of inventory increased for the third month in a row, bringing the current supply to 1.7 months. The market is balanced at 5-6 months so we still have a long way to go, but we are on the way.

Finally, months supply of houses and townhomes are starting to catch up with the supply of condos… and the supply in all price ranges is at least one month.

Months supply of inventory increased by 7.7% for previously owned homes and by 80.8% for new construction compared to last July.

The figures above are based on statistics for the combined 13-county Twin Cities metropolitan area released by the Minneapolis Area Association of Realtors.
Never forget that all real estate is local and what is happening in your neighborhood may be very different from the overall metro area.
Click here for local reports on 350+ metro area communities
Sharlene Hensrud, RE/MAX Results – shensrud@homesmsp.com
RELATED POSTS


