
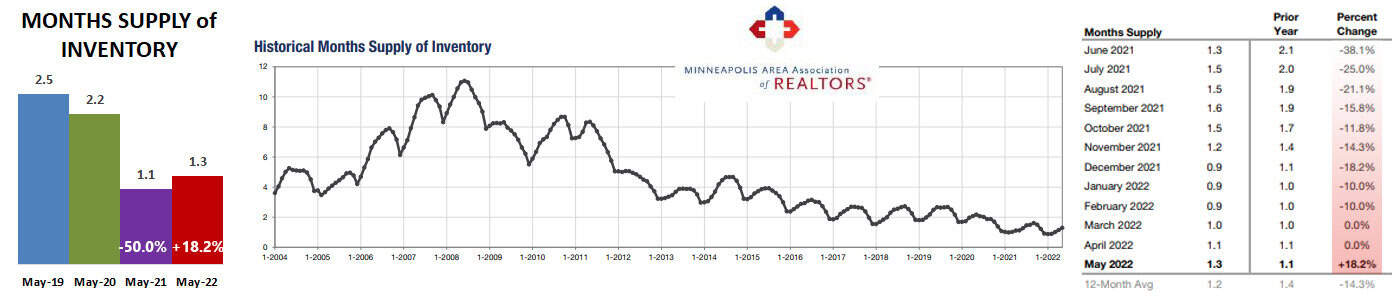
For the first time since March 2015, months supply of inventory increased rather than decreased in May 2022 compared to the same month in the previous year. While it decreased 50% last May, it increased 18.2% this year.
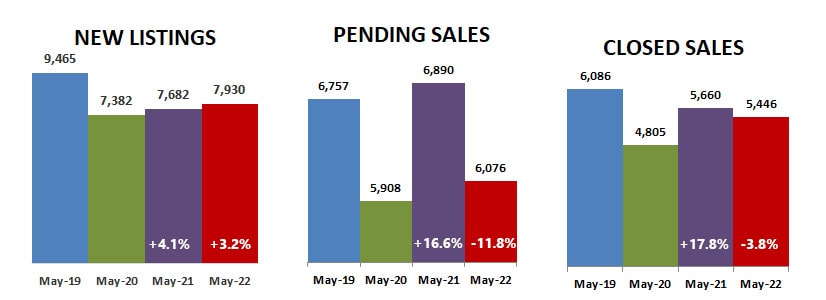
New listings increased 3.2% while closed sales decreased 3.8%. Pending sales decreased by 11.8%, a precursor of further reductions in closed sales in coming months.
Days on market continued to drop while percent of list price received inched up even higher than last year to 104.1%, a tie with June 2021 for the highest on record. Median sales price bumped up 9% over last May to $375,000, also the highest on record.
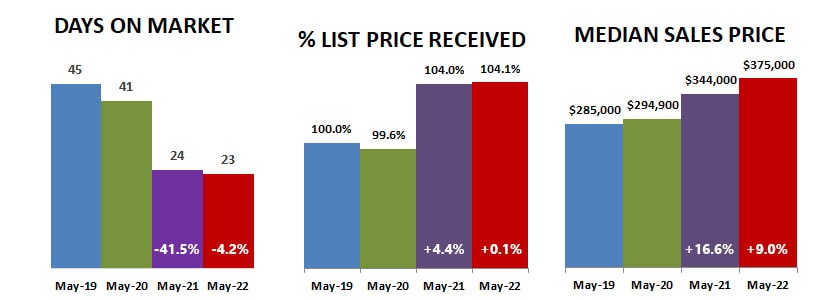
The fierce competition over a low supply of homes for sale resulted in an average of only 23 days on the market with sale prices an average 4.1% over list price. Median sales price increased 9% to a record high of $375,000.
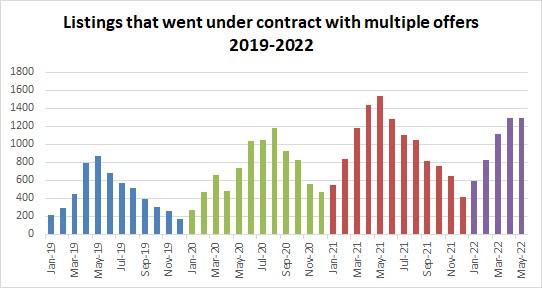
Multiple offers were still frequently expected, with calls for highest and best offers coming just days, and sometimes hours after a listing became active in the MLS. We don’t have a true way to track multiple offers, but searching for ‘multiple’ in agent comments at least shows the trend.
Just as pending sales reflect what is happening now, looking at the number of properties that pended with ‘multiple’ in their agent comments gives an indication of whether percent of list price will continue to rise. The graph below goes back to 2019, which was a more ‘normal’ year. You can see how multiple offers grew in 2020 and maxed out in 2021. This year started strong, but instead of increasing in May as it did last year, multiple offers leveled out and stayed about the same as in 2021. I expect we will see a decrease in June but don’t expect multiple offers to go away, just a reduction in the frenzy of the last two years.
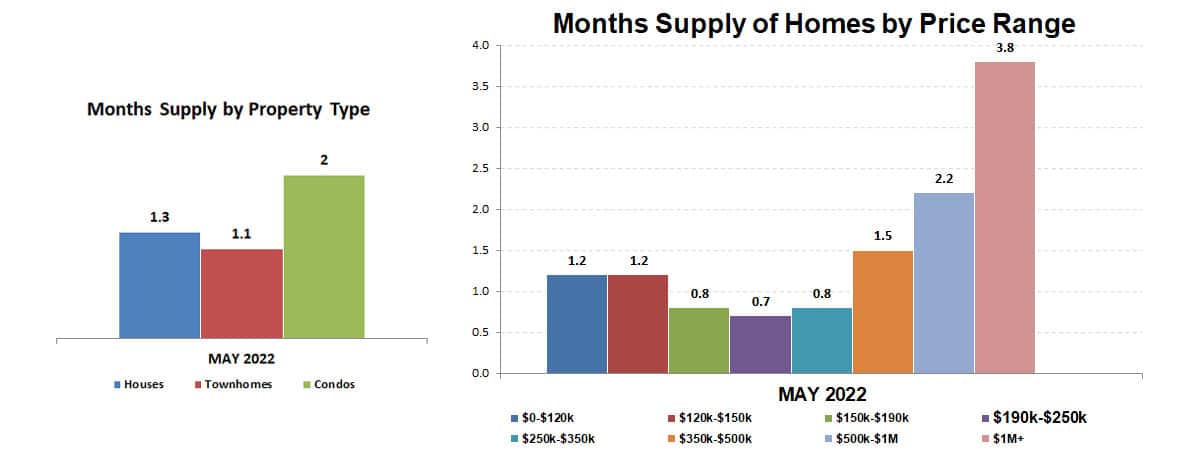
Months supply by price range and type increased compared to last month. It is still a very strong seller’s market, but you no longer have to expect immediate multiple offers. Although that still can happen, you may actually have a day or two to consider your purchase before making an offer.
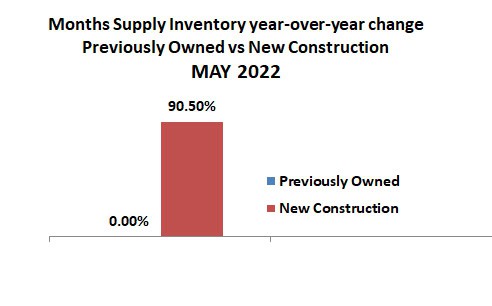
Months supply of previously owned property stayed the same as last year, but new construction supply increased 90.5%!
The figures above are based on statistics for the combined 13-county Twin Cities metropolitan area released by the Minneapolis Area Association of Realtors.
Never forget that all real estate is local and what is happening in your neighborhood may be very different from the overall metro area.
Click here for local reports on 350+ metro area communities
Sharlene Hensrud, RE/MAX Results – shensrud@homesmsp.com
RELATED POSTS


