
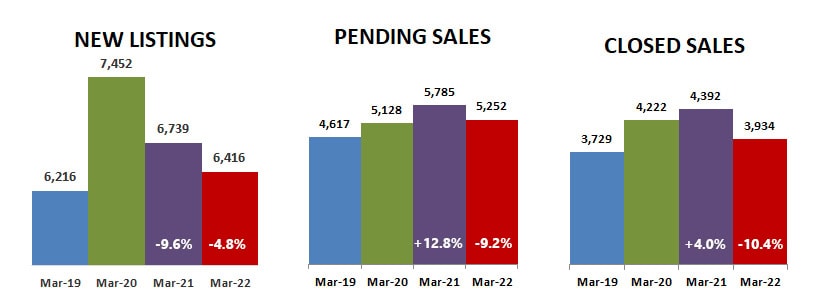
The real estate market continues to have high demand, but it is starting to show signs of softening. Pending and closed sales in March 2021 were ahead of March 2020, but in March 2022 they were both down compared to last year. New listings were down 4.8% compared to last March, and closed sales were down 10.4% and pending sales weren’t far behind at 9.2% below last year.
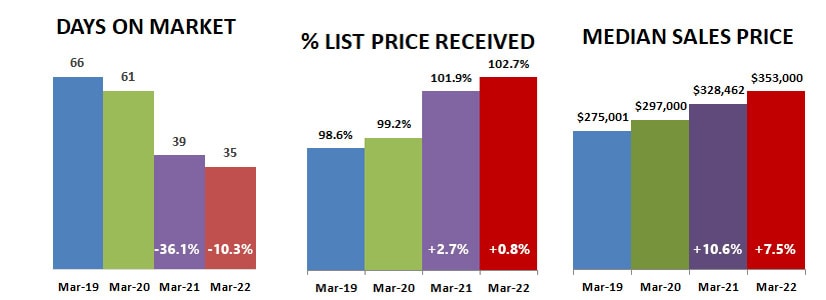
But the drop in sales isn’t due to lack of interest but rather lack of supply. Days on market dropped to 35 days, % list price received increased to 102.7% and median sales price increased to $353,000, the highest on record… all indicating very stiff competition for the low supply of homes on the market.
What I find most interesting is comparing the changes in the last three years. The biggest changes took place between 2020 and 2021… changes between 2021 and 2022 are lower, an indication the market is moderating.
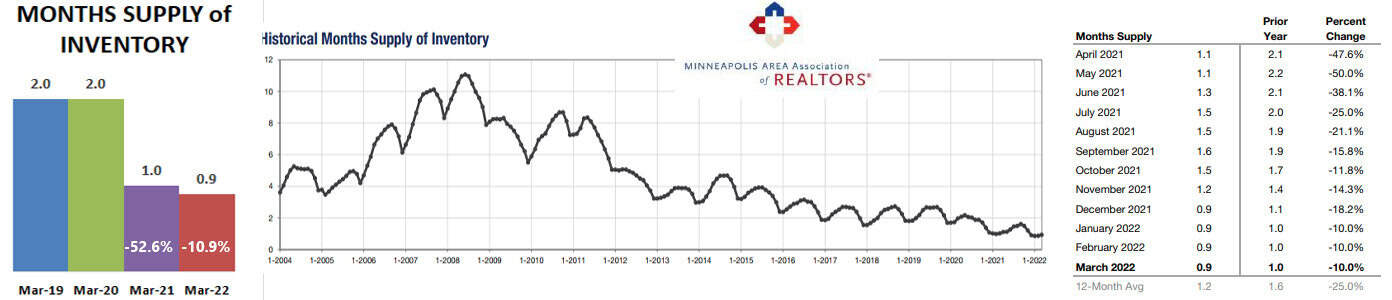
Months supply of inventory dropped 54.6% from March 2020 to March 2021. It dropped again in March 2022, but only 10.9% compared to March 2021… a huge difference. Months supply of inventory has been the same for 4 months in a row at 0.9 months, unusual for this time of year but indicative of buyer demand not allowing the supply to increase.
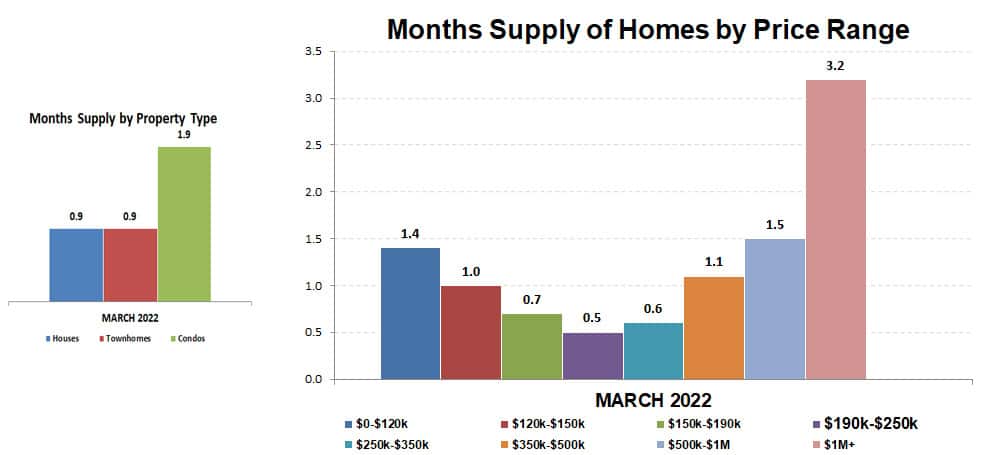
Months supply of inventory by price range continues to be a seller’s market in all price ranges. (Market is considered balanced between buyer and seller when there is a 5-6 month supply.) Houses and townhouses are again tied at 0.9 months, with condos having a month greater supply a 1.9 months.

New construction is working to fill the housing supply need, but supply chain issues and rising costs are holding both suppliers and buyers back because of resultant rising consumer prices.
Nevertheless, months supply of inventory has risen 47.8% in March 2022 compared to last March, while the supply of previously owned home has dropped 22.2%.
Nationwide, new construction starts are up 22.3% compared to a year ago in spite of rising construction costs and increasing sale prices and mortgage rates affecting buyer purchasing power.
The figures above are based on statistics for the combined 13-county Twin Cities metropolitan area released by the Minneapolis Area Association of Realtors.
Never forget that all real estate is local and what is happening in your neighborhood may be very different from the overall metro area.
Click here for local reports on 350+ metro area communities
Sharlene Hensrud, RE/MAX Results – shensrud@homesmsp.com
RELATED POSTS


