
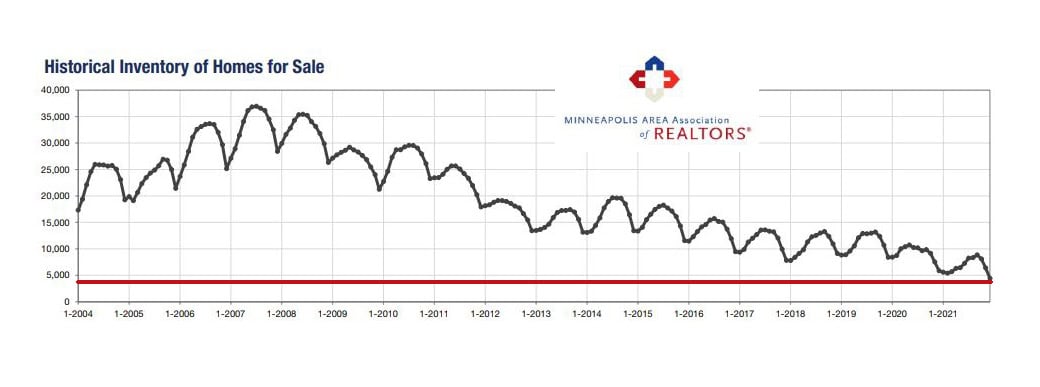
Declining inventory has been a major concern for a long time, but never more than in 2021. The chart above shows how it has been tumbling down for the last 10 years, and if you look at the supply of homes for sale on the chart below, you see that we had an inventory of 27, 740 homes for sale at the end of December 2007. In 2021, that number had fallen to 4,438… 24.1% below December 2020 which was already low… but 84% below 2007, or 23,202 fewer homes for sale!

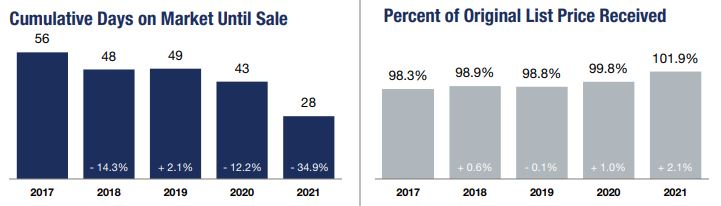
This shortage resulted in a dramatic 34.9% drop in days on the market as buyers rushed to submit offers before someone else grabbed it. Pressure caused by intense competition also resulted in an average sale price 101.9% of list price in 2021.
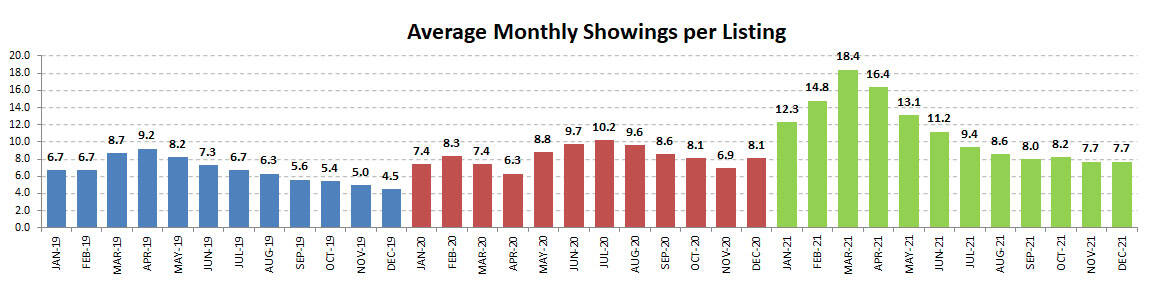
You can really see the frenzy when you look at average number of showings per listing over the last three years. 2019 was a fairly normal year… 2020 was a roller coaster year, with a strong start interrupted by the pandemic shutdown then an increase as people wanted more space, and ended the year at an uncharacteristically upward pace… but 2021 blew it out of the park. January-June was insane, with an average of 18.4 showings per listing before accepting an offer… keep in mind, this often occurred over only a few days. The last half of 2021 slowed down a bit as buyers got weary and inventory was disappearing (note the sharp drop in inventory the last three months in the first chart in this post).
The showings mirror the curve in housing supply, as buyers pounced on new listings when they hit the market. Annual new listings have pretty much stagnated the last five years while sales have increased, especially the last two years… no wonder inventory can’t keep up. 
The result of the competition for limited inventory is a steady climb in sales price over the last 10 years, with average sale prices reaching $393,290 in 2021, an 11.3% rise over 2020. Median sales price increased 11.4% over 2020 to $339,900.

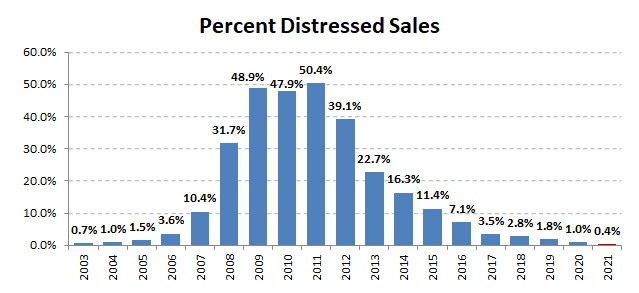
Buyers often ask me if foreclosures and short sales are in the MLS. The answer is yes, but they are few and far between… at 0.4% of closed sales in 2021 there aren’t many to be found. It is easy to understand why buyers are asking when you look at the history of distressed sales in the MLS below… ten years ago in 2011 foreclosures and short sales made up about half of all sales, 50.4%. In 2021 distressed sales made up only 0.4% of sales… even lower than in 2003!
I have long felt that months supply of inventory is the best indicator of the market because it takes into account both supply and demand. The market is considered balanced between buyer and seller when there is a 5-6 month supply of homes for sale.
As you can see below, months supply of inventory dropped to only 0.8 months in December 2021, the lowest on record. When you break it out by price range what is most surprising is that there is only a 2.4 month supply in price ranges $1,000,000 and above, an almost unbelievably low supply!

Supply varies not only by price, but also by new construction vs previously owned homes. The pandemic was hard on the construction industry, with pipeline delays forcing the months supply of new construction homes down to 2.9 months in 2020. Things gradually got a little better in 2021, bring the supply of new construction homes up to 3.3 months at the end of 2021. Supply of previously owned homes ended the year with a meager 0.5 month supply.

In 2020 sales of condos dropped due to the impact of the pandemic and a desire for more space… and because of downtown looting in the wake of the death of George Floyd. Things settled down more in 2021 and the supply of condos has dropped from 2.6 months to 1.6 months. Condos are no longer the fire sales they were in 2020.

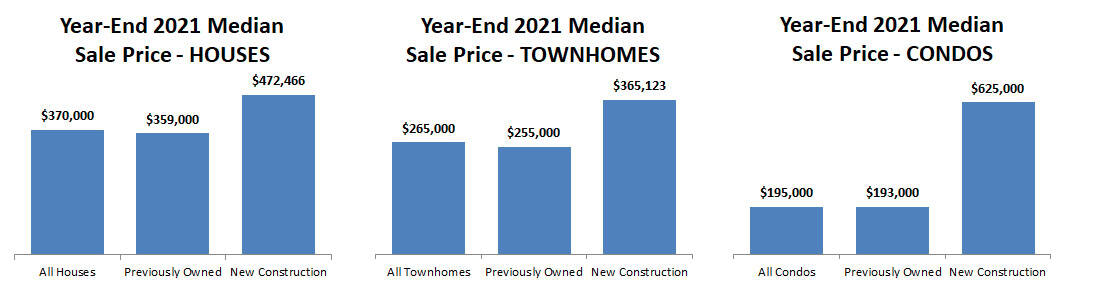
When median sale prices are broken out by both style and type, new construction condos commanded the highest median sale price.
The figures above are based on statistics for the combined 13-county Twin Cities metropolitan area released by the Minneapolis Area Association of Realtors.
Never forget that all real estate is local and what is happening in your neighborhood may be very different from the overall metro area.
Click for the full Annual Housing Market Report – Twin Cities Metro from the Minneapolis Area Association of Realtors.
Sharlene Hensrud, RE/MAX Results – shensrud@homesmsp.com
RELATED POSTS


