
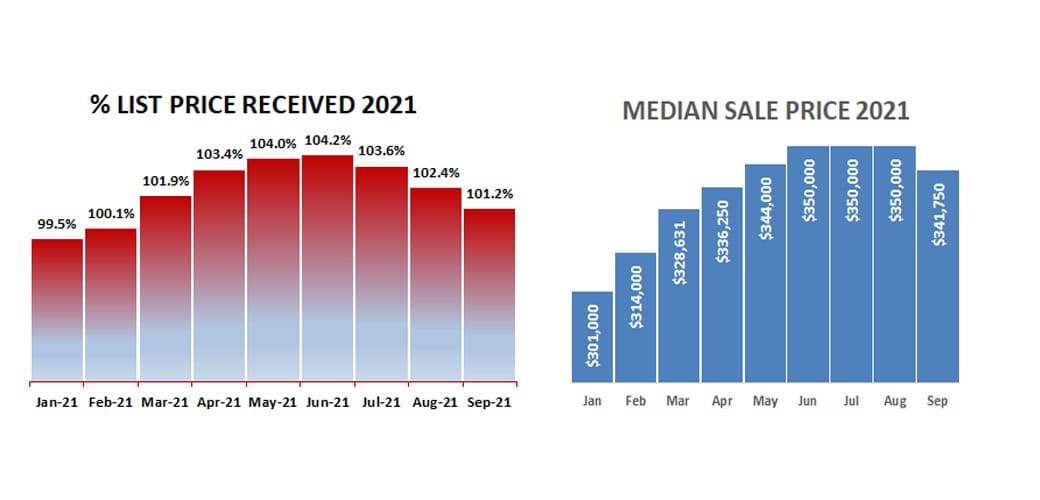
Percent of of list price received has been over 100% every month in 2021 since February. After peaking in June it has been gradually falling, following a typical seasonal curve. Average sale price in September 2021 was 101.2% of list price.
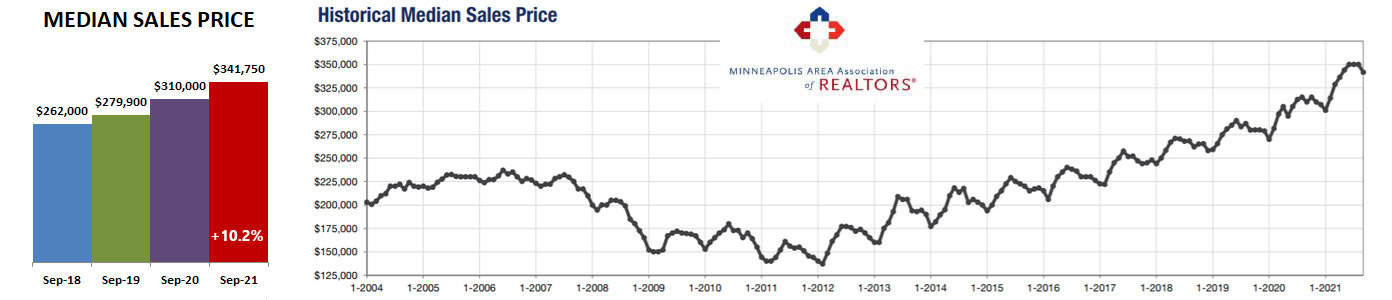
Median sales price of $341,750 was 10.2% over September 2020, but dropped month-over-month for the first time this year. Prices have been gaining year-over-year for over 9 years, which has homeowners smiling over their equity gains and is making potential buyers nervous. Although this can make homes less affordable for buyers, low interest rates still make homes affordable for many buyers. Important Distinction: Homes Are Less Affordable, Not Unaffordable It also has both buyers and sellers worried about What Does the Future Hold for Home Prices?
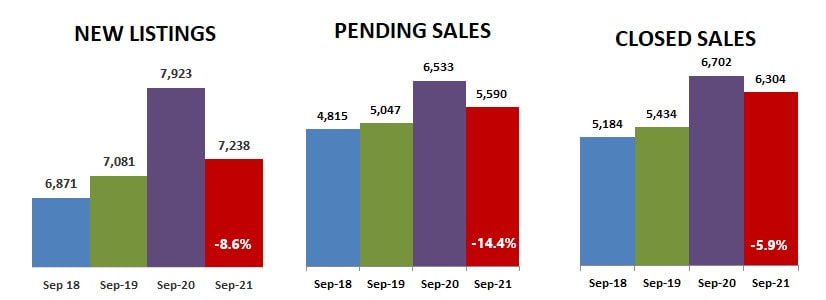
New listings, pending sales and closed sales all dropped year-over-year in September 2021 with pending sales dropping the most. It makes sense, with fewer new listings there are fewer options for buyers… plus some buyers are simply burned out from intense bidding wars all year.
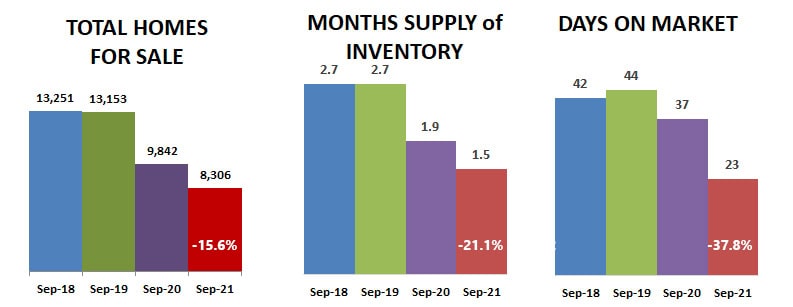
Inventory dropped 15.6%, but that is the smallest percentage drop in the last 12 months… average was 30.4%. Months supply of inventory dropped 21.1% but again that is the smallest drop all year, which averaged 40.0%. This pushed days on market down even more at 37.8%, to an average of only 23 days on market before pending.
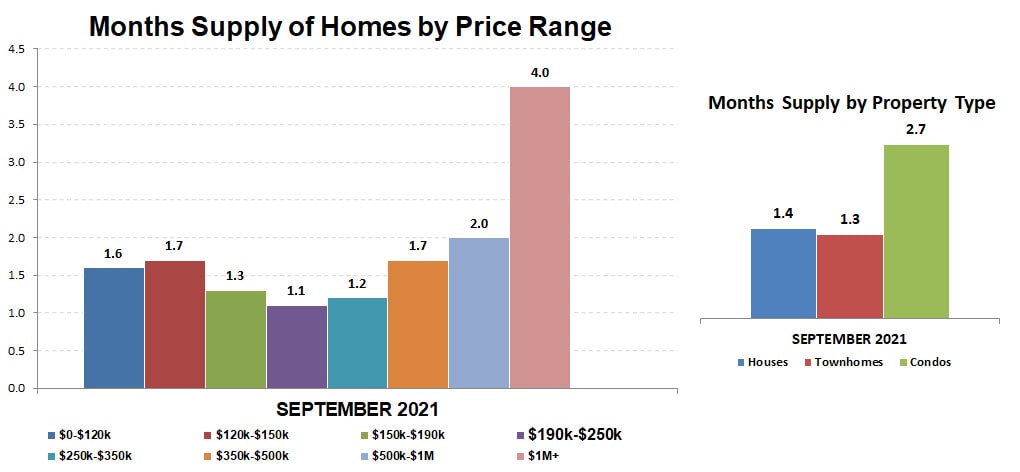
Months supply by price range continues to hang low for all price ranges, with the $190k-$250k price range in lowest supply as it has been all year. Condos continue to be the property type with the highest supply.
The lessening year-over-year drop in inventory supply can be heartening to buyers… as is the month-over-month drop in percent of list price received and median sales price, indicating less competition. It can be a breath of fresh air for weary buyers.
The figures above are based on statistics for the combined 13-county Twin Cities metropolitan area released by the Minneapolis Area Association of Realtors.
Never forget that all real estate is local and what is happening in your neighborhood may be very different from the overall metro area.
Click here for local reports on 350+ metro area communities
Sharlene Hensrud, RE/MAX Results – shensrud@homesmsp.com
RELATED POSTS


