
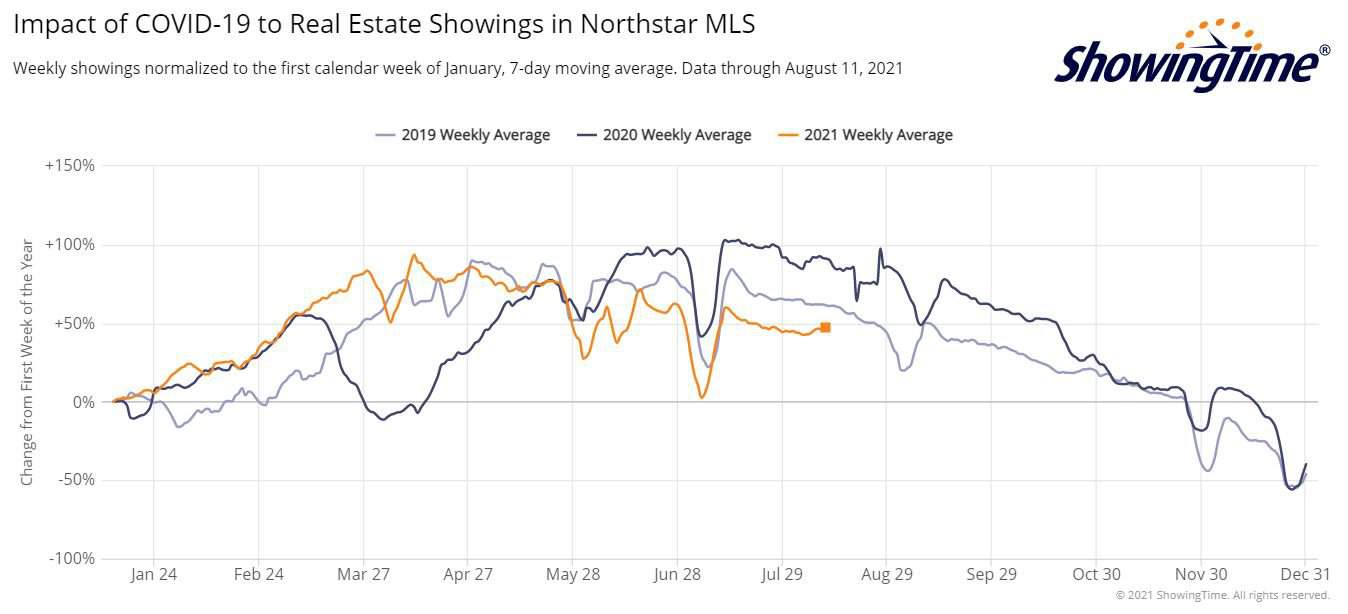
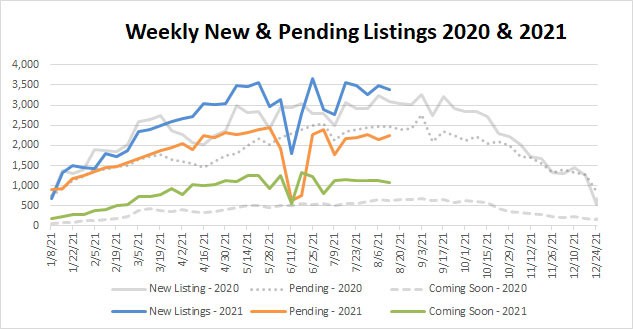
Real estate showings bucked the trend this week with a slight increase but still hanging below the last couple years… while new and coming soon listing continue to float above last year. Supply is still struggling to keep up with demand.
As prices continue to rise, there is more and more talk about a housing bubble and how housing prices are becoming less and less affordable. Keep in mind, however, that mortgage interest rates are still at incredible lows and that plays a big role in affordability. The article below from our blog at Keeping Current Matters includes a chart showing how, when adjusted for inflation, there were only two times in the last 45 years when it was less expensive to own a home than it is today.
Sharlene Hensrud, RE/MAX Results – shensrud@homesmsp.com

Are Houses Less Affordable Than They Were in Past Decades?
There are many headlines about how housing affordability is declining. The headlines are correct: it’s less affordable to purchase a home today than it was a year ago. However, it’s important to give this trend context. Is it less expensive to buy a house today than it was in 2005? What about 1995? What happens if we go all the way back to 1985? Or even 1975?
Obviously, the price of a home has appreciated dramatically over the last 45 years. So have the prices of milk, bread, and just about every other consumable. Prices rise over time – we know it as inflation.
However, when we look at housing, price is just one component that makes up the monthly cost of the home. Another key factor is the mortgage rate at the time of purchase.
Let’s look back at the cost of a home over the last five decades and adjust it for inflation by converting that cost to 2021 dollars. Here’s the methodology for each data point of the table below:
- Mortgage Amount: Take the median sales price at the end of the second quarter of each year as reported by the Fed and assume that the buyer made a 10% down payment.
- Mortgage Rate: Look at the monthly 30-year fixed rate for June of that year as reported by Freddie Mac.
- P&I: Use a mortgage calculator to determine the monthly principal and interest on the loan.
- In 2021 Dollars: Use an inflation calculator to determine what each payment would be when adjusted for inflation. Green means the homes were less expensive than today. Red means they were more expensive.
 As the chart shows, when adjusted for inflation, there were only two times in the last 45 years that it was less expensive to own a home than it is today.
- Last year: Prices saw strong appreciation over the last year and mortgage rates have remained relatively flat. Therefore, affordability weakened.
- 2010: Home values plummeted after the housing crash 15 years ago. One-third of all sales were distressed properties (foreclosures or short sales). They sold at major discounts and negatively impacted the value of surrounding homes – of course homes were more affordable then.
At every other point, even in 1975, it was more expensive to buy a home than it is today.
Bottom Line
If you want to buy a home, don’t let the headlines about affordability discourage you. You can’t get the deal your friend got last year, but you will get a better deal than your parents did 20 years ago and your grandparents did 40 years ago.


