
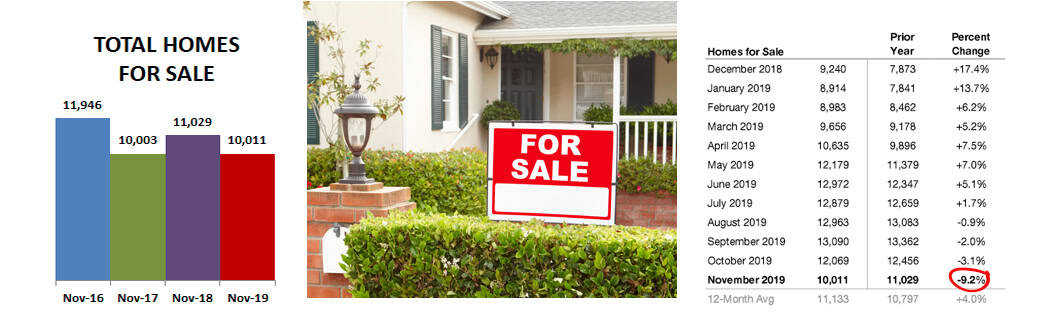
Last year at this time I was reporting that in November inventory rose for the first time in 2018. After a positive stretch of growing inventory for the first seven months of 2019, November showed a drop of 9.2% compared to 2018… the biggest drop this year. Why is inventory dropping again… back to the level in 2017? While there are always multiple factors, perhaps most significant is interest rates were rising last year… mortgage rates are now about a full percentage lower than this time last year. With rental rates continuing to rise and both unemployment and mortgage rates low, more renters are becoming buyers and depleting the supply. Inventory supply will likely again be the biggest concern in the real estate market in 2020.

New listings dropped 1.3%, but pending sales increased 2.8% as eager buyers snatched up new listings. Closed sales are an indication of what has been happening in prior months, down 0.8%. An interesting phenomenon I have been seeing with the intense competition for properties is more buyers making offers on properties before they are ‘sure’ for fear of losing out while they think about it… hence I have noticed an increase in properties coming back on the market as those buyers cancel rather than close sales.

Days on market before pending continued to drop, to an average of 51 days. Although percent of list price received wasn’t as high as the 100% received on closed sales in May and June, it still was 97.5%, 0.2% higher than last November. Median sales price was up 5.6% over last year, at $279,900.

Months supply of inventory, which takes into account both the number of homes for sale and the rate at which buyers are purchasing them, is the same as last year… both in total supply and broken out by property type. Townhomes continue to be in shortest supply.
When broken out by price range, all price ranges over $150,000 have a lower supply than last year at this time. Most notably, homes in the $500k-$1M range showed a decrease of 23.1%… from a 5.2 month supply in November 2018 to a 4.0 month supply this year.

The data in this post comes from statistics released by the Minneapolis Area Association of Realtors. They offer interesting insights below into the potential of increased economic risk.
While many economic signs are quite strong, total household debt has been rising for twenty-one consecutive quarters and is now $1.3 trillion higher than the previous peak of $12.68 trillion in 2008. While delinquency rates remain low across most debt types (including mortgages), higher consumer debt loads can limit future household spending capability and increase risk if the economy slows down.
Never forget that all real estate is local and what is happening in your neighborhood may be very different from the overall metro area.
Click here for local reports on 350+ metro area communities
Sharlene Hensrud, RE/MAX Results – shensrud@homesmsp.com
RELATED POSTS


