

As the seemingly endless drop in inventory continues it made me think of the never-ending snowstorm last weekend… it just kept falling, and falling, and falling. Months supply of inventory in March 2018 was 1.7 months, 22.7% below March 2017. That means it would take 1.7 months for the entire supply to be sold if sales continue at the same rate. The market is considered balanced when the supply is 5-6 months. We are currently experiencing an extreme sellers market… compare that to July 2008 when there was an extreme buyer’s market with a 10.6 months supply!
It is not surprising that as the inventory supply dropped so did the the number of days on market before sale, down to 57 days in March.

After a spring bump up in new March listings the last couple years, 2018 new listings fell by 17.5% compared to March 2017. It will be interesting to see what impact our never-ending April snow storms will have on new April listings… it’s hard to get your home ready for spring sales when it is still snowing in April!

Closed sales were down 10.3% in March 2008 compared to last year, but what concerns me more is the 12.2% drop in pending sales because that predicts coming sales. And our record April snowfall isn’t likely to help the market in April.

Median sale price and percent of list price received both continue to climb… not surprising given the number of listings that sell with multiple offers over list price.

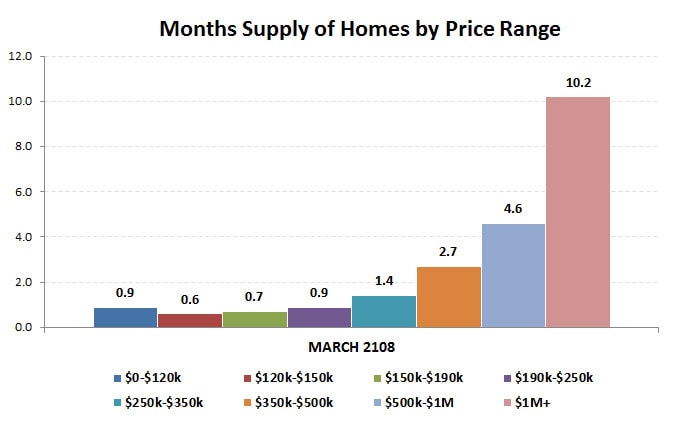
There are differences based on price range, but it continues to be a buyer’s market in all price ranges under $1,000,000. There is less than a one-month supply in price ranges under $250,000… no wonder many buyers are moving up to prices above their initial target price range.
Townhomes continue to be the housing type in shortest supply.

With a strong job market, the economy doing well and interest rates and rents rising, it is inventory supply that is holding back the housing market.
The figures above are based on statistics for the combined 13-county Twin Cities metropolitan area released by the Minneapolis Area Association of Realtors.
Never forget that all real estate is local and what is happening in your neighborhood may be very different from the overall metro area.
Click here for local reports on 350+ metro area communities
RE/MAX Results HomesMSP Team – info@homesmsp.com
RELATED POSTS
- February 2018 real estate market update… year-over-year inventory change has been negative for 3 years
- 2017 Annual Twin Cities Housing Market Review
- Worried about another housing bubble tsunami?
- Nationally, home prices appreciated by 37.4% over the last 5 years… what about Minnesota and the Twin Cities?


