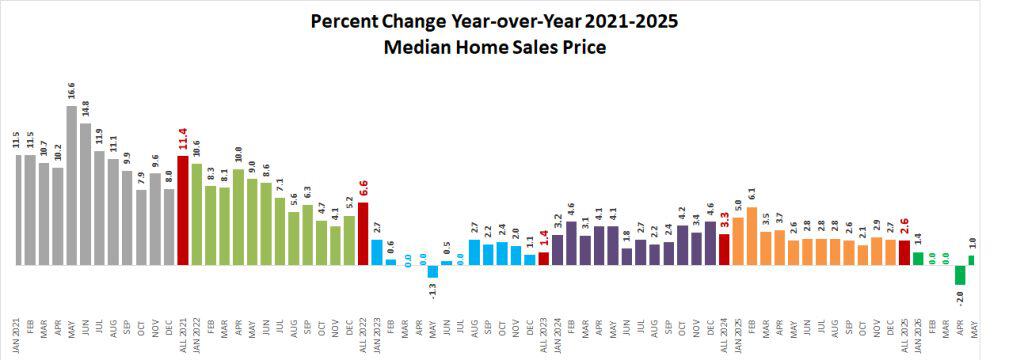
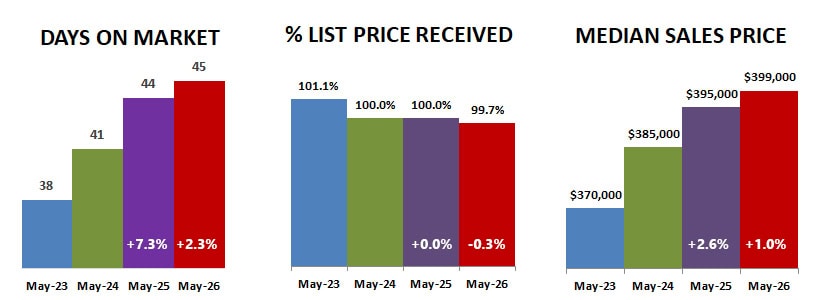
Last month year-over-year home prices fell after rising each month except one since February 2012. This month May median home sales prices rose again… only a modest 1.0% but still an increase after maintaining no change over last year in February and March and falling 2.0% in April.
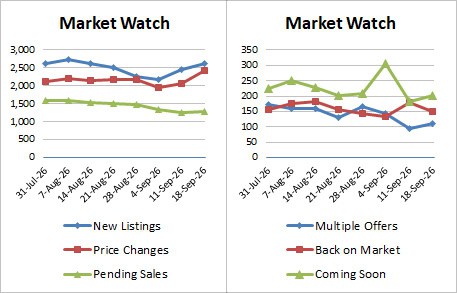
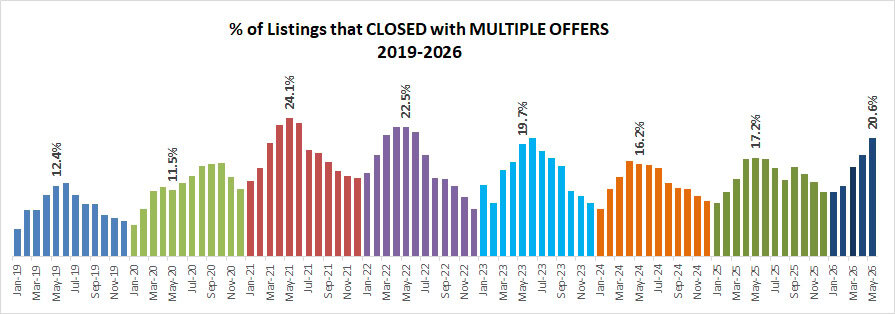
A contributing factor in the rise in sales prices was the increase in multiple offers… 20% of home sales in May closed with multiple offers mentioned in the MLS listing, and I know there were more because I was part of them.
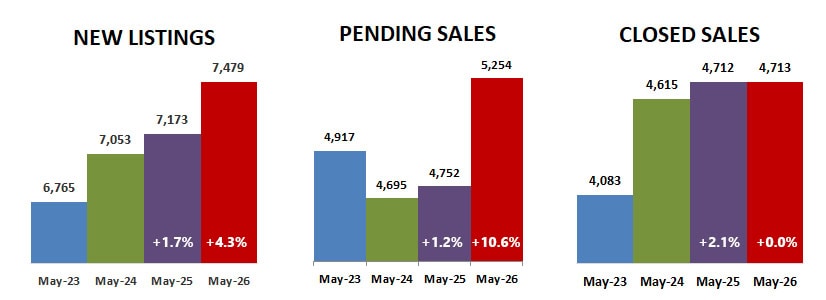
We should be able to expect more in coming months, because although closed sales were flat, new listings increased… and pending sales increased 10.6%. That suggests buyers are buying and competing for the new listings.
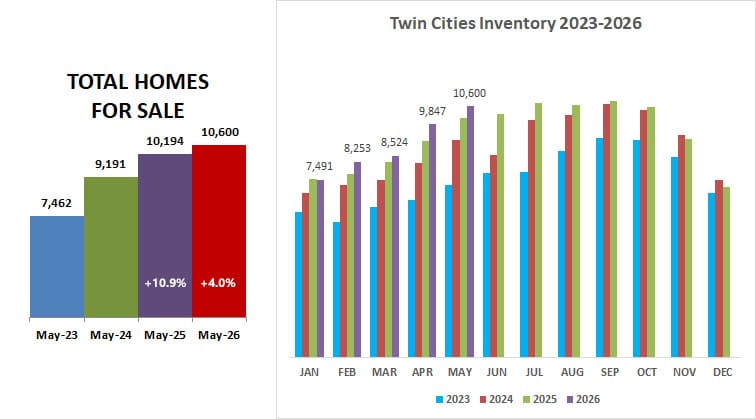
Total homes for sale in May 2026 rose 4.0% over last year.
Days on the market before pending were the lowest since last September, but 2.3% higher than last year at 45 days. Average percent of list price held at 100% for the last two years, then fell slightly to 99.7% in May 2026. Median sales price rose a modest 1.0% to $399,000.
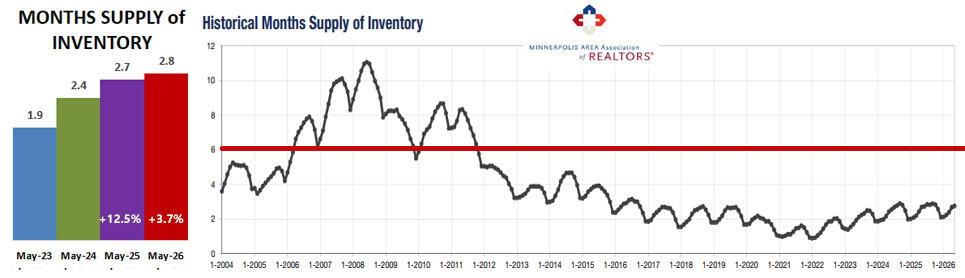
Months supply of inventory, which measures not just the number of homes for sale but also the rate at which they are selling increased again over last year in May 2026… up 3.7% year-over-year to a 2.8 month supply, but still way below a balanced market of 5-6 months indicated by the red line on the chart below.
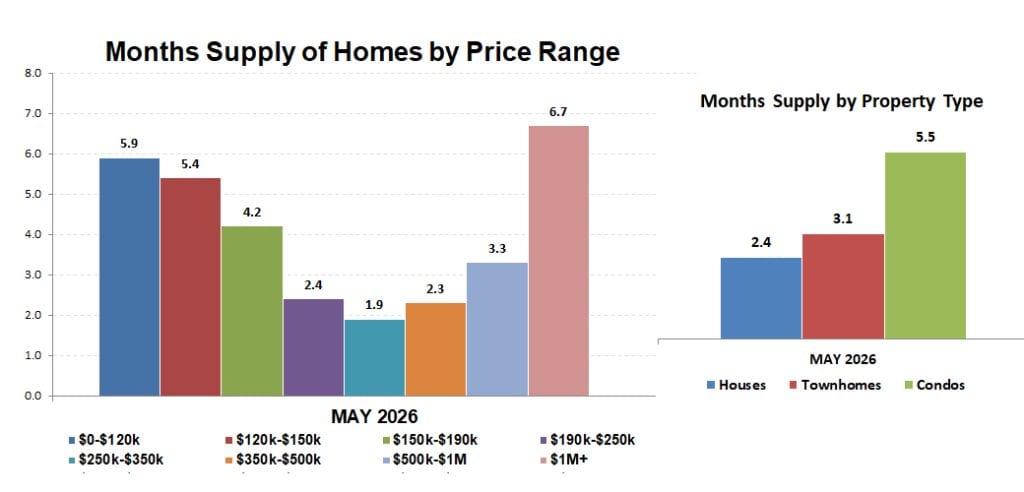
When months supply is broken down by price range, the $250k-$350k range still has the lowest supply at 1.9 months, with the $350k-$500k range not far behind at 2.3 months. Condos still have about twice the months supply as houses.
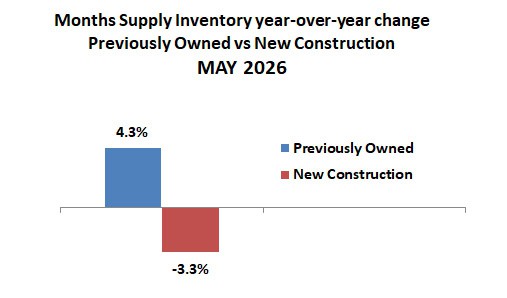
The supply of new construction properties fell 3.3% below last year’s supply while the supply of pre-existing homes rose 4.3%.
The figures above are based on statistics for the combined 13-county Twin Cities metropolitan area released by the Minneapolis Area Association of Realtors.
Never forget that all real estate is local and what is happening in your neighborhood may be very different from the overall metro area.
Check with your Realtor for information on what is happening in your neighborhood.
Sharlene Hensrud, RE/MAX Results – shensrud@homesmsp.com
RELATED POSTS