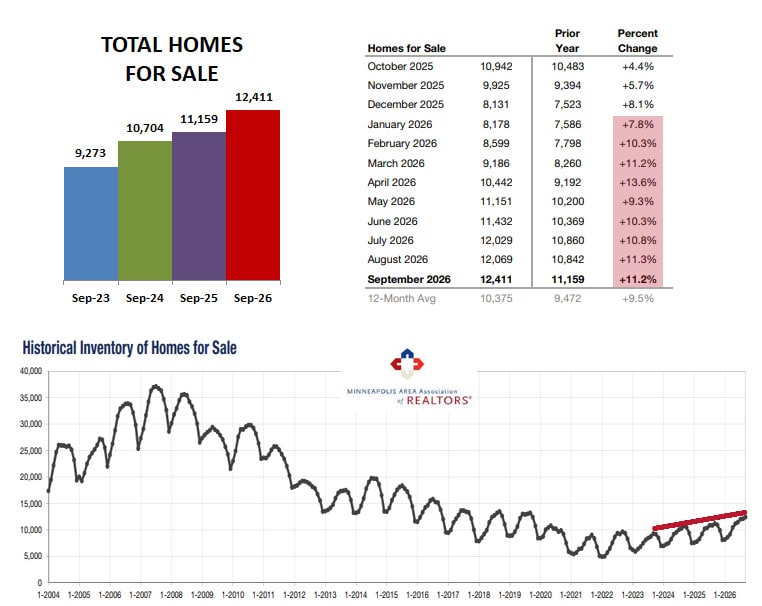
The number of homes for sale has been climbing year-over-year in the double digits for most of 2026. Twelve-month average change in inventory showed an increase of 9.5%, but for the 9 months of 2026 so far it has increased 10.6%. The total number of homes for sale has reached the highest number in 7 years.
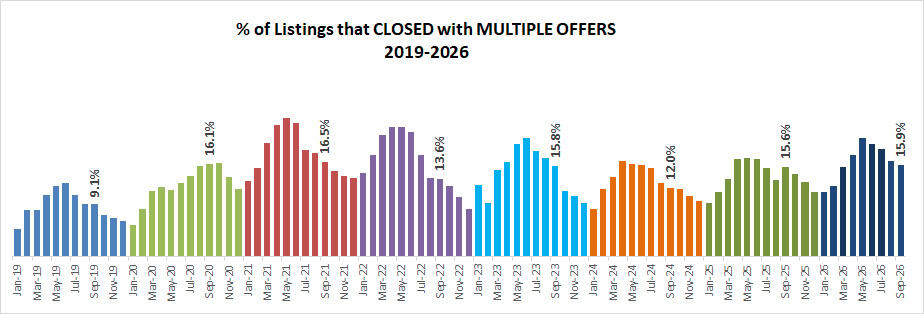
If you are an active homebuyer I don’t have to tell you about the competition when a new listing hits the market… resulting in multiple offers. The percent of listings that closed in September with multiple offers that I could track in the MLS was the highest since 2021, and I know there were even more than that.
But with interest rates now in the 7% range and expected to stay in the 7s into next year, some buyers are finding themselves squeezed out of the buying market. That, combined with the typical end-of-year slowdown as people focus on the holidays instead of homebuying and a continued increase in inventory can signal an opportunity for home-seekers financially ready to buy… with less competition and more choices.
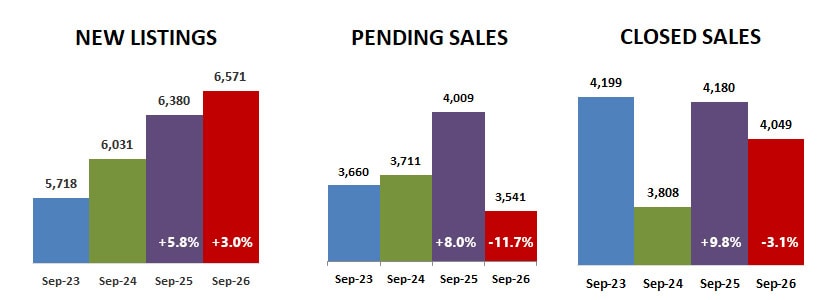
New listings continued to grow, while closed sales dropped and pending sales dropped even more… which could indicate an even greater increase in inventory as listings stay on the market longer.
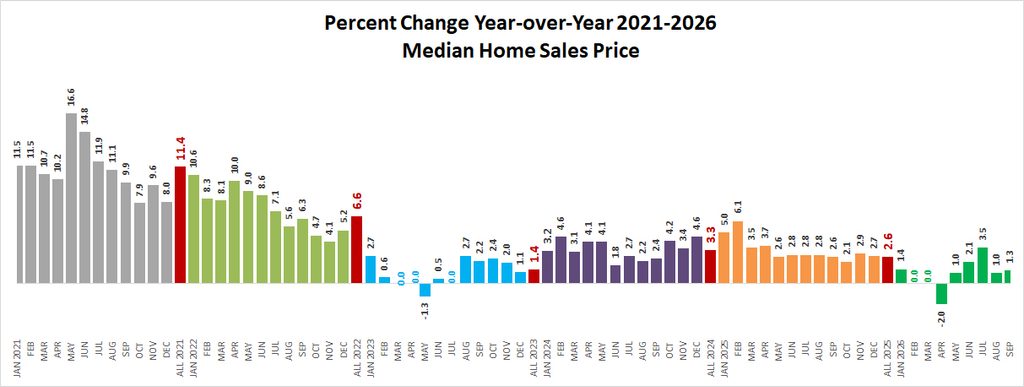
Days on the market before pending increased yet again… to 48 days. In spite of continued multiple offers, average % of list price received dropped to 97.7%. But median sales price still increased 1.3% to $395,000.

Year-over-year sales price increases have been more closely mimicking 2023, when interest rates rose after the pandemic mortgage stimulus expired.
Overall, there is a 3.2 month supply of inventory, still below a balanced market shown on the red line in the chart below. Months supply is the number of months it would take to sell of all current inventory at the current pace without any new listings. A balanced market is considered to be about a 5-6 month supply of homes for sale.

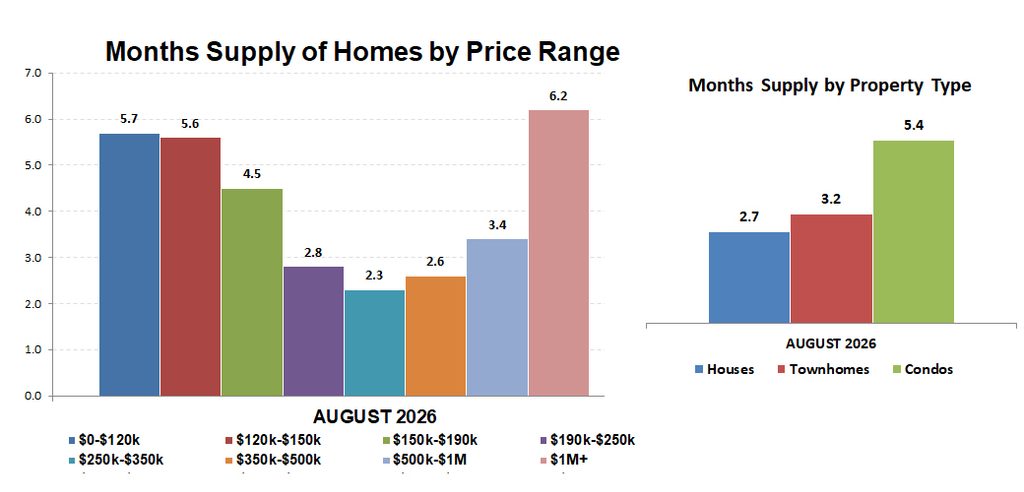
Looking at it by price range on the chart below, the $250k-$350k price range continues to be in highest demand, with only a 2.3 month supply, but $350k-$500k isn’t far behind with a 2.6 month supply. Interesting that the lowest prices and highest prices are the ones reaching buyer’s market range of 5-6 months. Condos continue to have about double the months supply as houses… with more opportunities for buyers.
The supply of previously owned homes far exceeded the change in supply of new construction in September 2026.

The figures above are based on statistics for the combined 13-county Twin Cities metropolitan area released by the Minneapolis Area Association of Realtors.
Never forget that all real estate is local and what is happening in your neighborhood may be very different from the overall metro area.
Check with your Realtor for information on what is happening in your neighborhood.
Sharlene Hensrud, RE/MAX Results – shensrud@homesmsp.com
RELATED POSTS