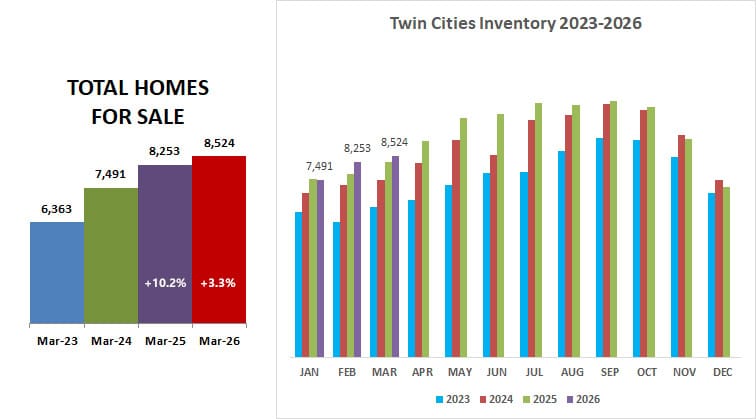
Lower mortgage rates helped boost US existing home sales 1.7% compared to March 2025, but closed sales were down 2.6% in the Twin Cities market. According to NAR (National Association of REALTORS) data, inventory continued to grow nationwide, with our market showing an uptick of 3.3% over last March.
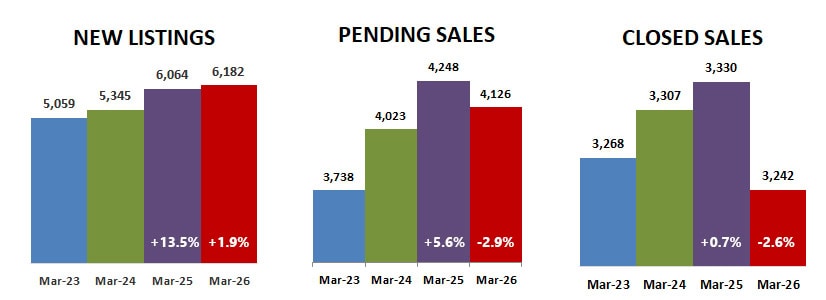
This was helped by an increase in new listings of 1.9%, plus a decrease of 2.9% in pending sales and a 2.6% decrease in closed sales.
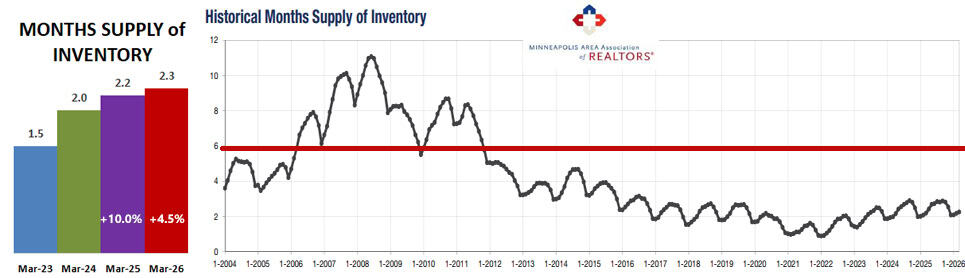
Months supply of inventory, which measures not just the number of homes for sale but also the rate at which they are selling increased year-over-year in March. Although it still has a long way to go to reach a balanced market of 5-6 months supply of inventory, it is starting to climb again.
Median sales price of $380,000 was tied with last March again as it was in February, and is also tied with December 2025.
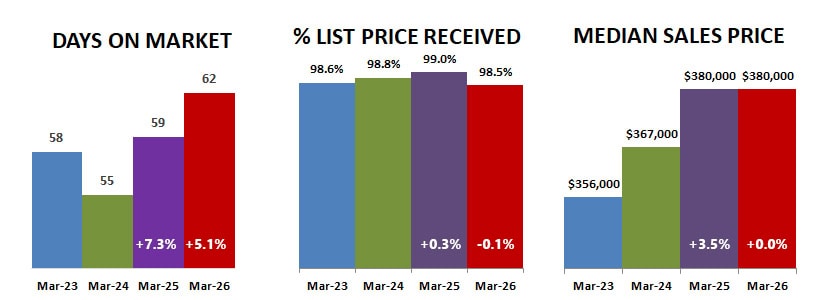
Days on market before pending is less than last month, but 5.1% more than March 2025. Percent of list price received has remained amazingly consistent, between 98.5% and 99.0% the last 4 years… March 2026 was the lowest, at 98.5%.
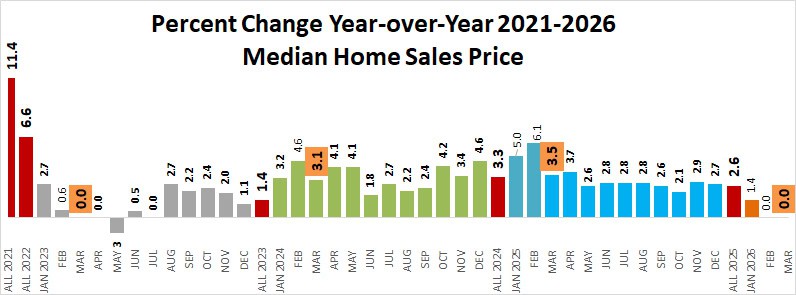
Looking at the percent change in year-over-year median sales price, 2026 has started the year more modestly than the last two years. Sales prices increased 11.4% in 2021 and 6.6% in 2022, what I consider the unicorn years. At this point in 2026, year-over-year price changes are more closely aligned with 2023, when mortgage interest rates were rising following record lows. Time will tell what the rest of the year brings.
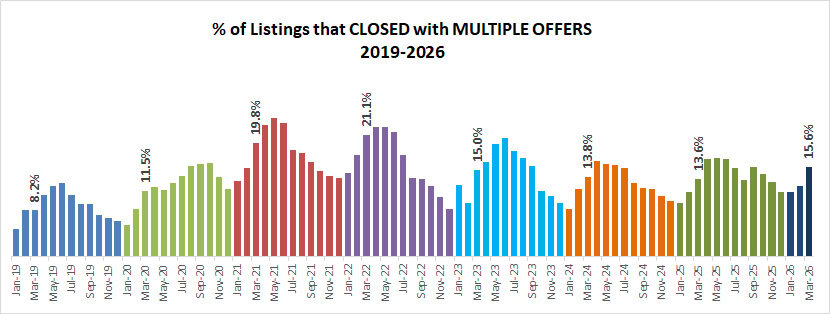
Due to the continued shortage of inventory compared to demand, multiple offer competition is even stronger than it was in 2023. At least 15.6% of sales involved multiple offers, and likely more that were not documented in the MLS. If you are looking to negotiate price, your best bet is looking at properties that have been on the market awhile.
Looking at homes by price range, the lowest supply (and greatest competition) is in the $250k-$350k price range with only a 1.6 month supply. However, even homes in the $350k-$1M range can face competition with less that a 3-month supply. Homes in the $1M+ price range have a more balanced market, with a 5.5 month supply. Condos have more than twice the months supply as houses and townhomes.

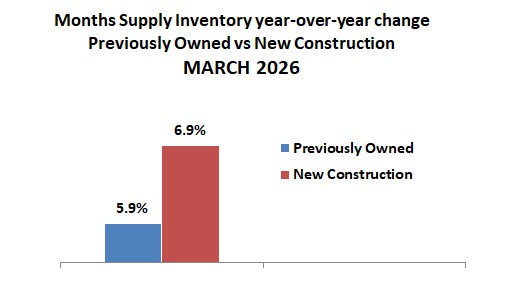
The supply of new construction homes has again increased more than previously owned homes, now at a 6.2 month supply, which is balanced between buyer and seller. However, in spite of a good increase in previously owned homes for sale there is still only a 1.8 month supply… leading to fierce competition and frequent multiple offers.
The figures above are based on statistics for the combined 13-county Twin Cities metropolitan area released by the Minneapolis Area Association of Realtors.
Never forget that all real estate is local and what is happening in your neighborhood may be very different from the overall metro area.
Check with your Realtor for information on what is happening in your neighborhood.
Sharlene Hensrud, RE/MAX Results – shensrud@homesmsp.com
RELATED POSTS