
January stats are in and shows that the market continues to improve, even in the dead of winter. Closed January sales have been steadily rising the last four years while at the same time new listings have been dropping… resulting in buyers competing for a low supply of homes for sale….

…which in turn leads to only a 2.9 month supply of homes for sale. That is a strong seller's market, with the month's supply even lower than in the boom years of 2004 and 20005.

The supply of inventory relative to buyers steadily rose to a peak in 2008, and has now dramatically fallen to its lowest level according to the chart above from the Minneapolis Area Association of Realtors going back to 2004.
As supply hit record highs in 2008 prices went down… and now prices have been going up as supply has hit record lows… sound like the laws of supply and demand?

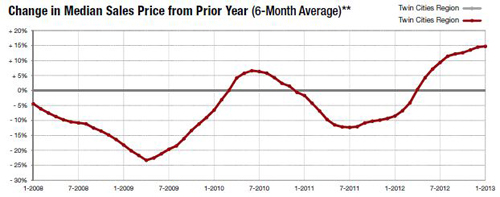
You can see the wave of change in median sales price from the prior year in the chart above from the Minneapolis Area Association of Realtors going back to the decline in 2008.
 Median sale price for the Twin Cities metro area was $160,000 in January 2013, up 14.3% compared to last January. The laws of supply and demand indicate that prices should continue to rise this year.
Interest rates and prices have both started to climb and buyers are realizing that now is the time to buy. Did you know that the difference in monthly payments between 3.53% and 4.40% interest on a $250,000 home is $125 per month? That can make a difference on the home you can afford to buy… and 4.40% is still a great interest rate!
The figures above are based on statistics for the combined 13-county Twin Cities metropolitan area released by the Minneapolis Area Association of Realtors.
Never forget that all real estate is local and what is happening in your neighborhood may be very different from the overall metro area.
- Click here for local reports on 350+ metro area communities
- Click here for current interactive market analytics by area, city, county, neighborhood or zip code
Sharlene Hensrud, RE/MAX Results – Email – Minneapolis – St. Paul Real Estate Market
RELATED POSTS
